Fig. 7.
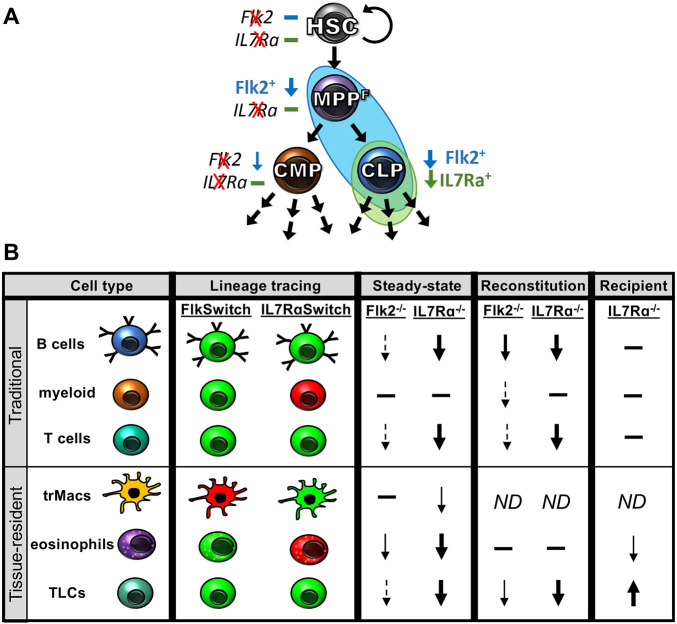
Model summary of Flk2- and IL7R-mediated effects on hematopoiesis. (A) The Flk2 and IL7R effects on downstream progeny are likely asserted at least in part by their expression on early hematopoietic progenitors, including multipotent progenitor cells (MPPF) and common lymphoid progenitors (CLPs). Flk2 expression on MPPs, CLPs and downstream lymphoid cells is indicated by blue Flk2+ text and by blue background. IL7R expression on CLPs and downstream lymphoid cells is indicated by green IL7R+ text and green background. The blue and green arrows indicate that the respective cell type is reduced upon deletion of either Flk2 or IL7R. (B) Differential effects of Flk2 and IL7R in the development and maintenance of hematopoietic cell types. Columns depict cell types, lineage tracing, steady-state analysis, HSC reconstitution of WT recipients and WT HSC transplantation into IL7R-deficient recipients. Rows depict six categories of immune cells: traditional B, T or myeloid cells (rows 1-3), or tissue-resident macrophages (trMacs), lung eosinophils, and lymphoid cells (TLCs) (rows 4-6). Results of Flk2 and IL7R lineage tracing are indicated in red (no history of expression) and green (differentiation occurred via cells expressing Flk2 or IL7R). Results of Flk2 and IL7R deletion on cell numbers is indicated by arrows pointing up (increase) or down (decrease); magnitude of change indicated by weight of arrows (dashed arrows, smallest change; thick arrow, largest change) no change is indicated by a horizontal bar; ND, no data.

