Figure 6.

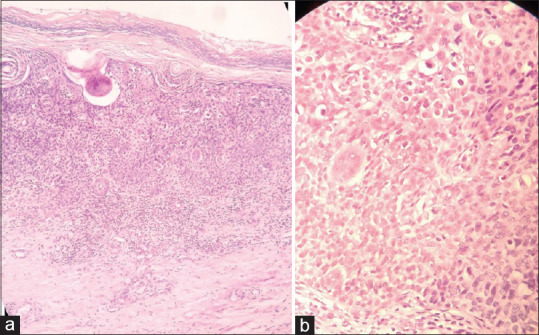
(a) Staining showing full thickness atypia/dysplasia (H and E 10x). (b) Staining showing areas of hyperchromasia, pleomorphism, and atypical mitosis (H and E 40x)

(a) Staining showing full thickness atypia/dysplasia (H and E 10x). (b) Staining showing areas of hyperchromasia, pleomorphism, and atypical mitosis (H and E 40x)