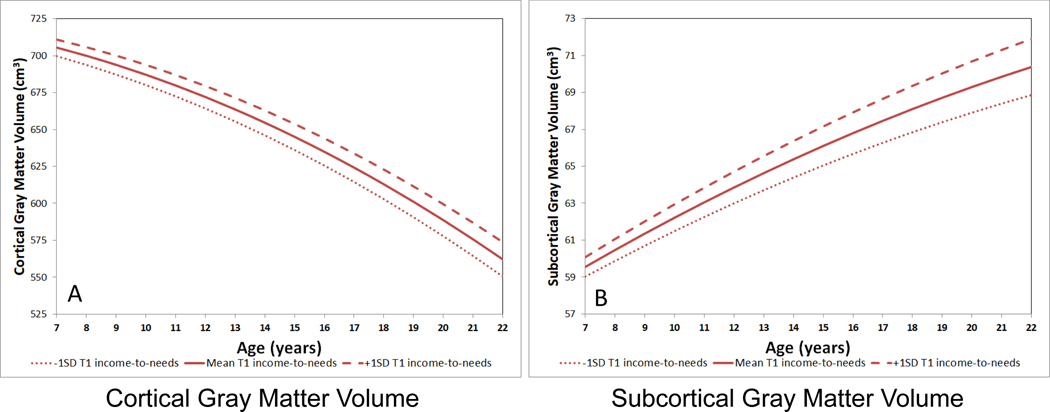
Figure 1: Trajectories of Cortical and Subcortical Gray Matter as a Function of T1 Income-to-needs Ratio.
A) Trajectory of cortical gray matter, with the estimated fit lines plotted separately for the mean T1 income-to-needs and +/− 1 standard deviation; B) Trajectory of subcortical gray matter, with the estimated fit lines plotted separately for the mean T1 income-to-needs and +/− 1 standard deviation. These graphs were generated using the original values for interpretation, though the analyses were run on standardized variables. Mean values of 0.5 (neutral) for sex and 1547.9 cm3 for intracranial volume were entered into the model equation.

