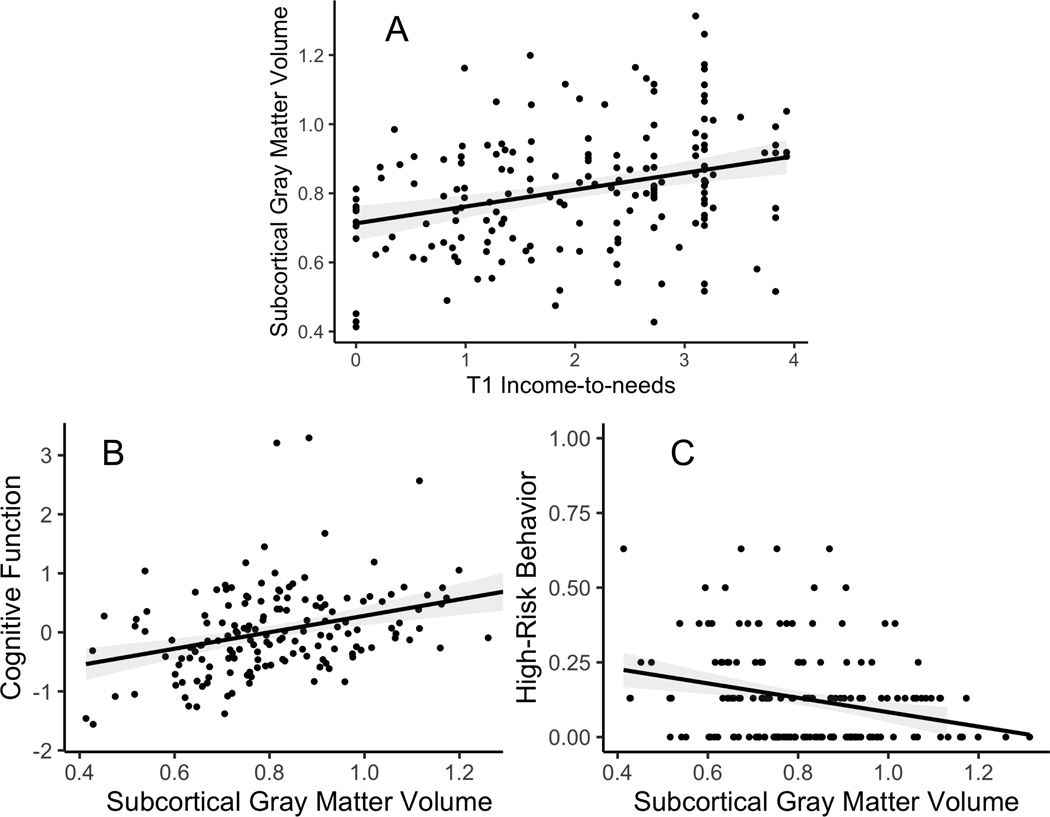
Figure 3: Graphs Illustrating Bivariate Relationships Subcortical Gray Matter Volumes.
A) Scatterplot depicting the relationship between T1 income-to-needs and the slope of subcortical gray matter volume, with the estimated linear fit and 95% confidence interval overlayed. B) Scatterplot depicting the relationship between the slope of subcortical gray matter volume and cognitive function, with the estimated linear fit and 95% confidence interval overlayed. C) Scatterplot depicting the relationship between the slope of subcortical gray matter volume, and high-risk behaviors with the estimated linear fit and 95% confidence interval overlayed.

