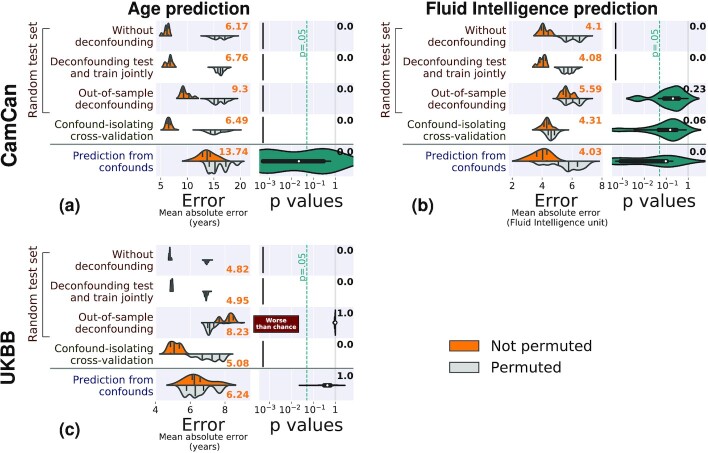
Figure 6.
: Comparisons on population-imaging data. Each subfigure shows 1 prediction setting: (a) CamCan Age prediction, (b) CamCan fluid intelligence prediction, (c) UKBB age prediction. The left column of each subfigure reports the prediction performance as the mean absolute error for the 5 approaches considered: prediction from the data without deconfounding, prediction after deconfounding test and train jointly, prediction with out-of-sample deconfounding, prediction with confound-isolating cross-validation, and prediction from confounds. The left column displays the distribution across validation folds for the actual data (top, orange), and for permuted data distribution (bottom, gray). The right column displays the distribution of P-values across folds, obtained by permutation, and the text yields the aggregated P-value across folds (see main text), testing whether prediction accuracy is better than chance. Test subsets always represent one-fifth of the whole dataset. The figure clearly displays different behaviors across the 3 problems: without deconfounding, and deconfounding test and train jointly yield statistically significant but probably spurious accuracy; out-of-sample deconfounding can be overconservative (the prediction is worse than chance on UKBB), suggesting that the deconfounding model removes too much variance; confound-isolating cross-validation yields more nuanced results, and prediction from confounds yields variable results.

