
Figure 7.
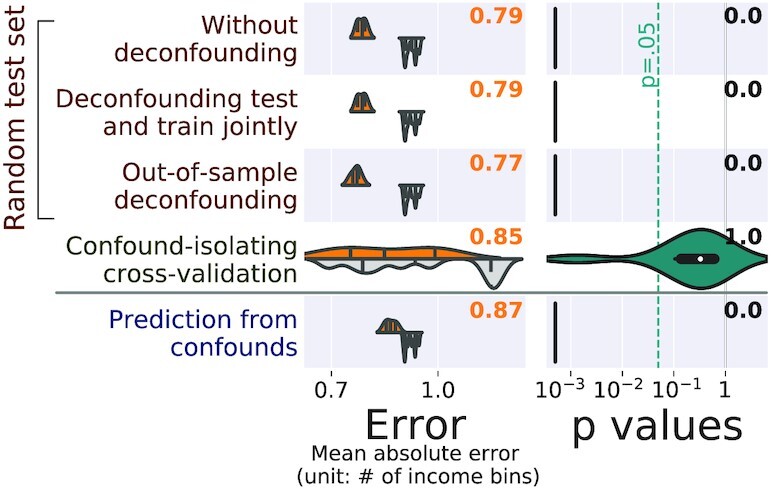
: Comparisons on tabular data: predicting income from sociodemographic characteristics and mental health, controlling for qualifications. The left column of the figure reports the prediction performance by the mean absolute error for the 5 approaches considered: prediction from the data without deconfounding, prediction after deconfounding test and train jointly, prediction with out-of-sample deconfounding, prediction with confound-isolating cross-validation, and prediction from confounds. The left column displays the distribution across validation folds for the actual data (top, orange), and for permuted data distribution (bottom, gray). The right column displays the distribution of P-values across folds, obtained by permutation, and the text yields the aggregated P-value across folds (see main text), testing whether prediction accuracy is better than chance.