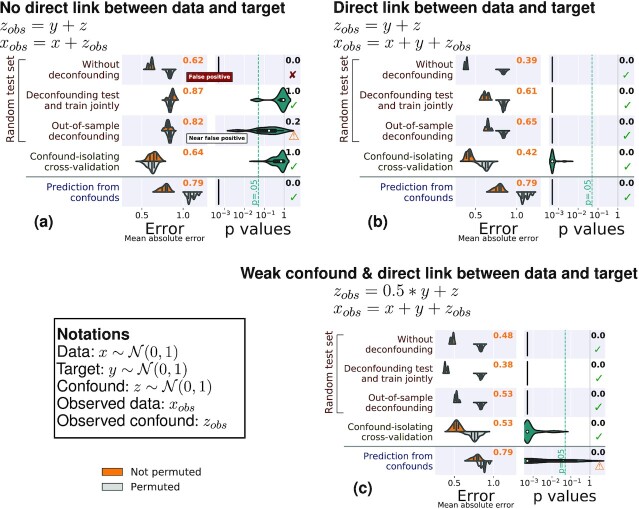
Figure 8:
Benchmarking approaches to control confounded predictions on simulated data with many samples. The left column of each subfigure assesses the prediction performance through the mean absolute error (in signal units). We display the error distribution across validation folds for the data (top, orange) and for permuted data distribution (bottom, gray). The right column displays the distribution of P-values across folds, obtained by permutation, and the text reports the aggregated P-value across folds (see main text). Five approaches are benchmarked: without deconfounding, deconfounding test and train jointly, out-of-sampling deconfounding, confound-isolating cross-validation, and prediction from confounds. There are 3 simulation settings: (a) no direct link between target and brain, (b) a direct link between target and brain, and (c) a weak confound and a direct link between target and brain. Green ticks indicate correct conclusions, red crosses mark incorrect ones, and warning signs, the weak results.

