Figure 1.

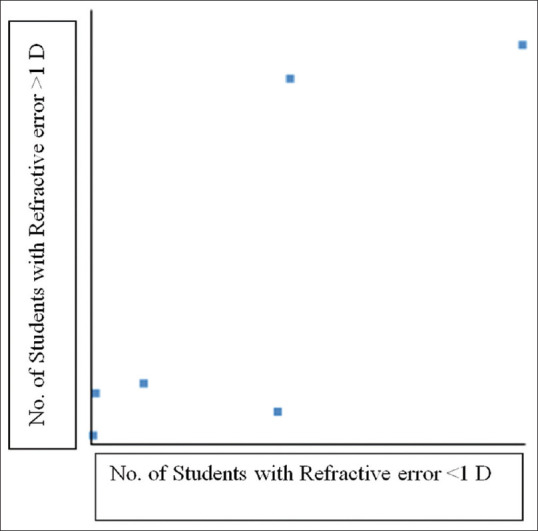
Pearson correlation coefficient depicting positive correlation between number of students with refractive error <1 D and >1 D. r(4) =0.82, significant at P < 0.05

Pearson correlation coefficient depicting positive correlation between number of students with refractive error <1 D and >1 D. r(4) =0.82, significant at P < 0.05