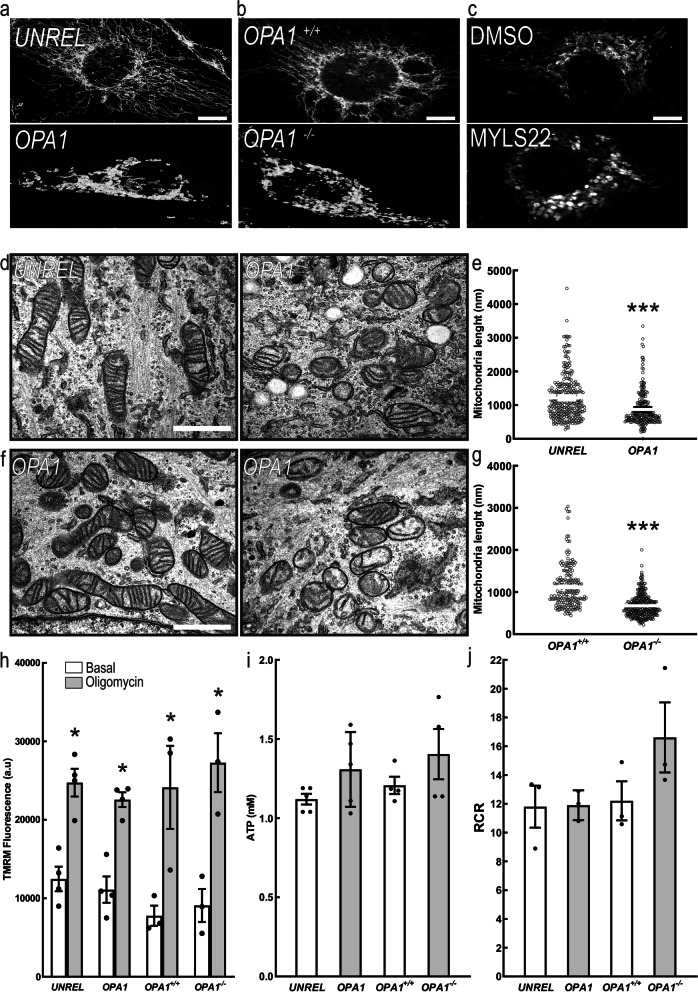
Fig. 5.
OPA1 ablation does not affect mitochondrial metabolism of breast cancer cells in vitro. Representative confocal images of mitochondrial morphology in MDA-MB-231 transfected with the indicated siRNA for 72 h and stained for TOM20. Scale bar: 30 μm. a Representative confocal images of mitochondrial morphology in MDA-MB-231 with the indicated genotype and stained for TOM20. Scale bar: 30 μm. b Representative confocal images of mitochondrial morphology in MDA-MB-231 treated 24 h with MYLS22 (50 μM) or DMSO and stained for TOM20. Scale bar: 30 μm. c Representative EM images of MDA-MB-231 transfected for 72 h with the indicated siRNA. Scale bar: 500 nm. d Quantification of mitochondrial length in experiments as in (d). n = 240 mitochondria/condition from 3 independent experiments. *** p < 0.001. e Representative EM images of MDA-MB-231 with the indicated genotype. Scale bar: 500 nm. f Quantification of mitochondrial length in experiments as in (f). n = 200 mitochondria/condition from 3 independent experiments. *** p < 0.001. g Quantitative analysis of mitochondrial TMRM fluorescence in MDA-MB-231 transfected with the indicated siRNA for 72 h; MDA-MB-231 OPA1+/+ and MDA-MB-231 OPA1−/−. Where indicated, cells were treated with the TMRM (0.5 nM), the ATP synthase inhibitor oligomycin (2 μg/mL) and the uncoupler FCCP (2 μM). Data represents mean ± SEM, n = 4. *: p < 0.05. h Total ATP levels were measured in MDA-MB-231 transfected with the indicated siRNA for 72 h; MDA-MB-231 OPA1+/+ and MDA-MB-231 OPA1−/−. n = 5 independent experiments. i Quantification of respiratory control ratio (RCR) calculated as State 3/ State 4 of MDA-MB-231 transfected with the indicated siRNA for 72 h; MDA-MB-231 OPA1+/+ and MDA-MB-231 OPA1−/−

