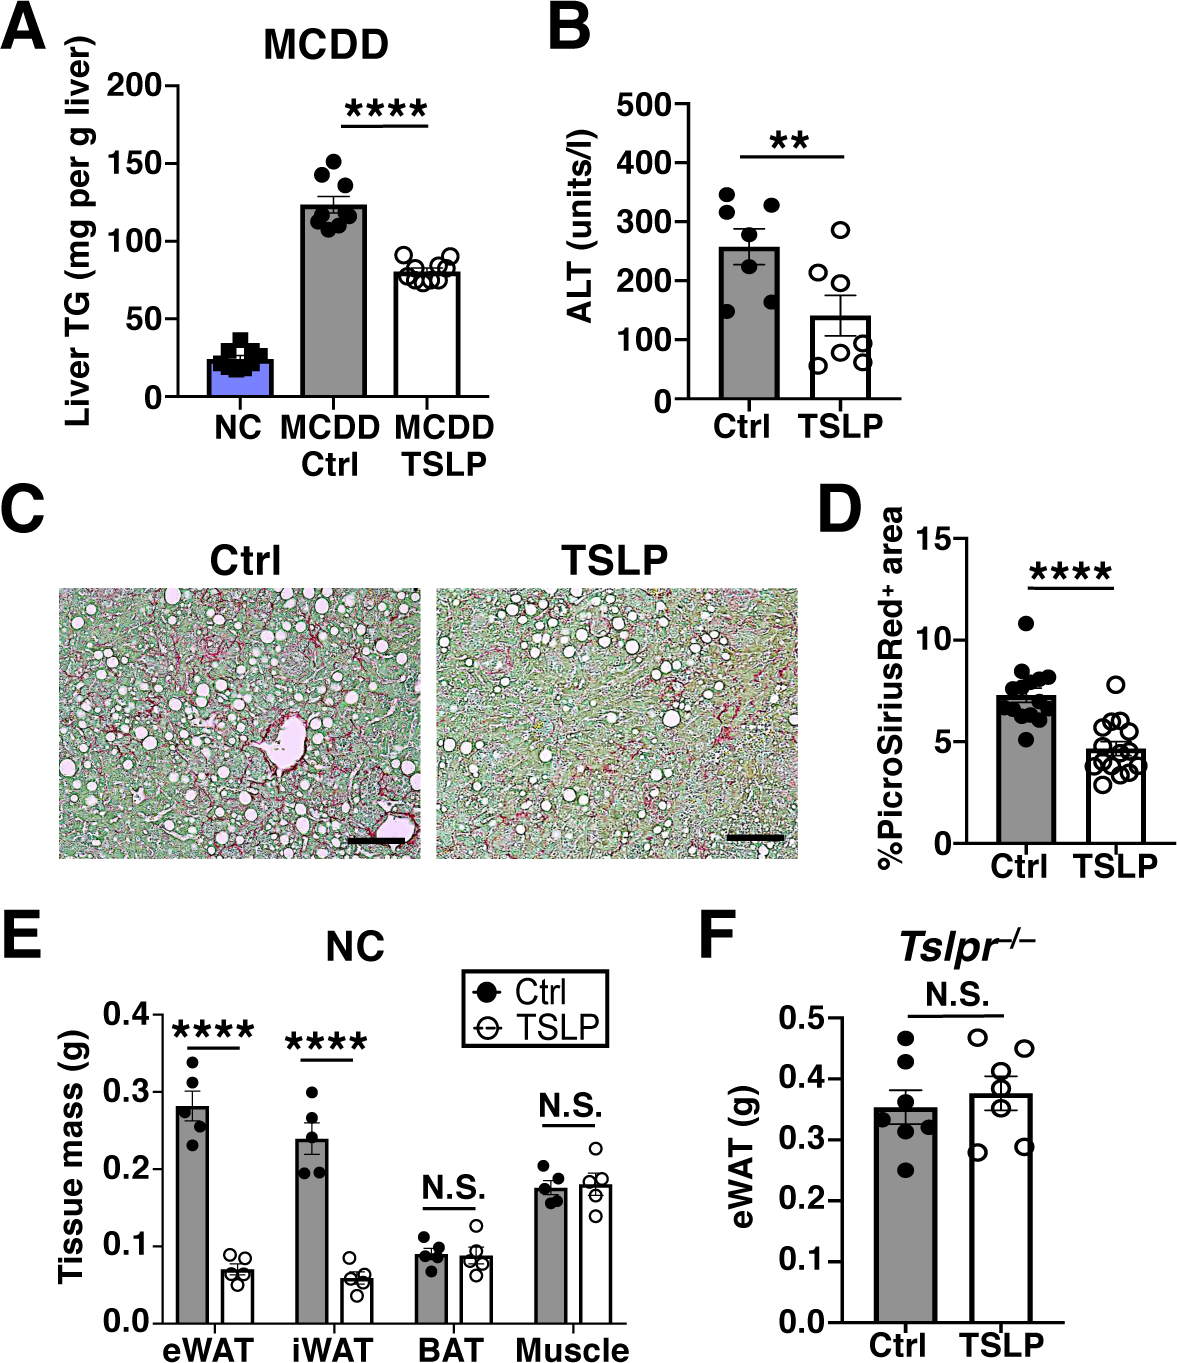
Fig. 2. TSLP ameliorates MCDD-driven liver damage and induces selective white adipose loss in NC-fed mice.

(A to D) Mice fed MCDD for 4 weeks prior to AAV and for another 4 weeks thereafter. (A) Liver TGs (n=9–10 mice/MCDD group, pooled from 2 independent experiments, with n=9 NC mice shown for reference). t-test. (B) Serum ALT levels (n=7 mice/group, pooled from 2 independent experiments). t-test. (C and D) Representative PicroSiriusRed liver staining and quantification (n=15 mice/group, pooled from 3 independent experiments). t-test. Scale bars=100 μm. (E and F) NC-fed mice. (E) eWAT, iWAT, BAT, and quadriceps muscle masses, 2 weeks post AAV (n=5 mice/group, 1 representative of at least 10 independent experiments shown). Student’s t test. (F) eWAT masses of Tslpr−/− mice, 2 weeks post AAV (n=7 mice/group, pooled from 2 independent experiments). t-test. N.S., P≥0.05, **P<0.01, ****P<0.0001. Data are mean ± SEM.
