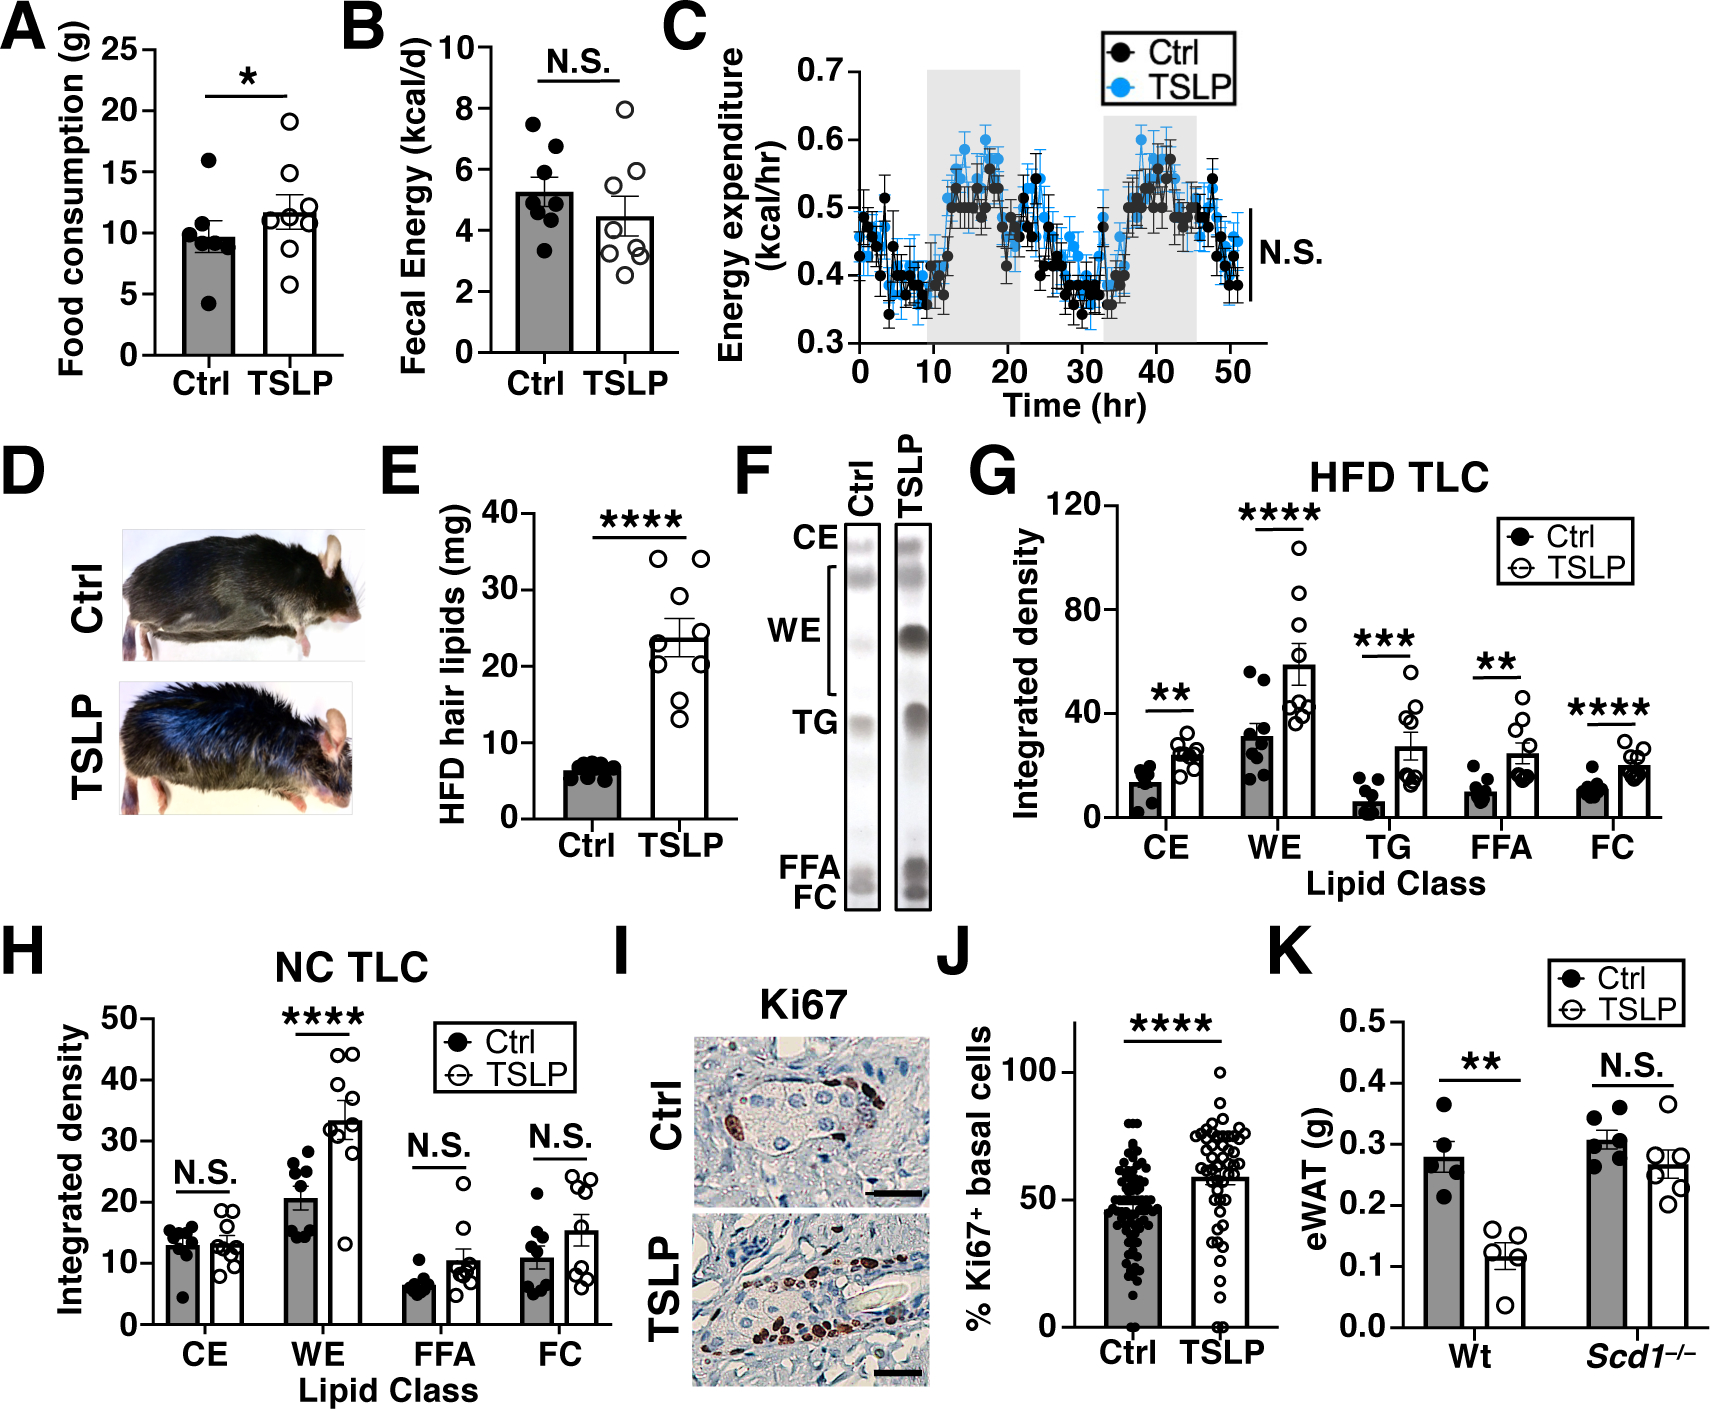
Fig. 4. TSLP induces adipose loss by promoting sebum secretion.

(A) Food consumption, 9–11 days post AAV (n=7–8 mice/group, 1 representative of 2 independent experiments shown). Student’s t test. (B) Fecal calories, 9–11 days post AAV (n=8 mice/group, pooled from 2 independent experiments). t-test. (C) Energy expenditure, 9–11 days post AAV (n=7–8 mice/group, 1 representative of 2 independent experiments shown). ANOVA. (D to G) Mice fed HFD for 10 weeks prior to AAV and for another 4 weeks thereafter. (D) Gross appearance. (E) Hair lipid mass (n=9 mice/group, pooled from 3 independent experiments). t-test. (F and G) TLC plot and quantification of hair lipids (CE=cholesterol esters, WE=wax esters, TG=triglycerides, FFA=free fatty acids, FC=free cholesterol, n=9 mice/group, pooled from 3 independent experiments). t-test. (H) TLC quantification of hair lipids from NC-fed mice, 10 days post AAV (n=9 mice/group, pooled from 3 independent experiments). t-test. (I and J) Sebaceous gland Ki67 staining and quantification, 10 days post AAV (n=78 Ctrl and 50 TSLP sebaceous glands from three mice/group, pooled from 2 independent experiments). t-test. Scale bars=20 μm. (K) eWAT masses of Wt or Scd1−/− mice, 2 weeks post AAV (n=5–6 mice/group, pooled from 2 independent experiments). t-test. N.S., P≥0.05, *P<0.05, **P<0.01, ***P<0.001, ****P<0.0001. Data are mean ± SEM.
