
Figure 5.
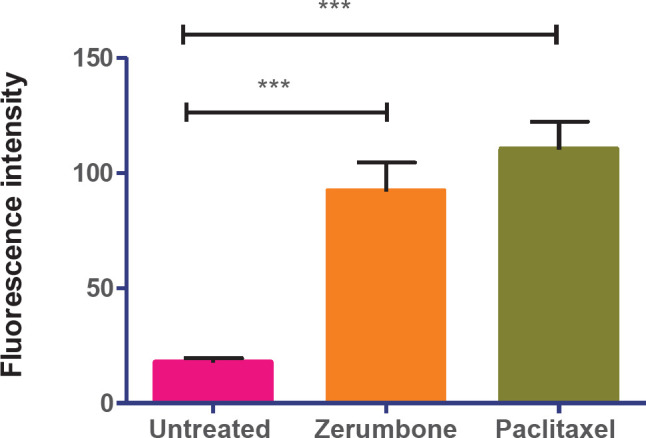
Reactive oxygen species (ROS) generation in treated MCF-7 cells. Fluorescence intensity after the treatment of IC50 of zerumbone and paclitaxel. The graph shows that zerumbone induces cellular ROS almost similar to paclitaxel. The data represent the mean ± standard deviation (SD) of 3 independent experiments. Statistical analysis is defined as significant if *P<0.05, **P<0.01, and ***P<0.001