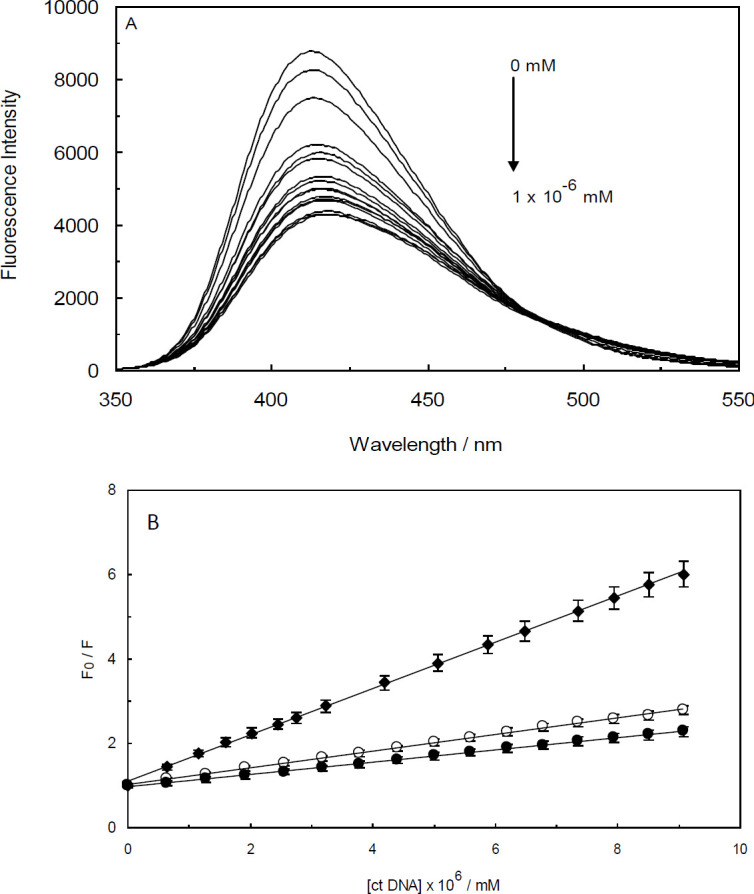
Figure 2.

(A) Fluorescence spectra of Ambochlorin (Amb) (0.07 mM) in the presence of different concentrations of ctDNA (0 - 1 × 10⁻⁶ mM) at T=298 K and pH 6.8. (B) Stern-Volmer plots for Amb-ctDNA complex at 298 (closed circles), 303 (open circles) and 308 K (closed diamond)
