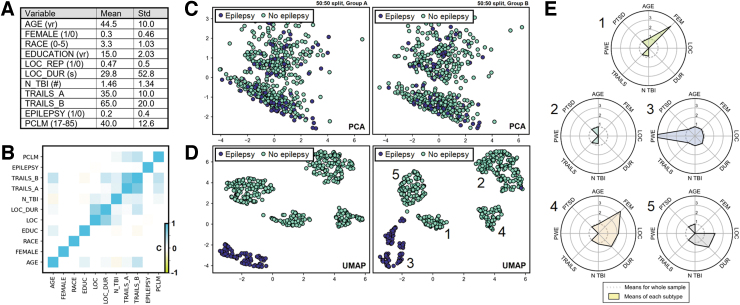
FIG. 2.
PhenoBench data generation and example outputs from a synthetic post-traumatic epilepsy (PTE) data set. (A) Inset table of means and standard deviations for the synthetic data set (N = 1000). Explanation of the variables are provided in the documentation. (B) Heatmap of the correlation matrix for the 11 synthetic variables. (C) PCA two-principal component reduction of the pseudo data set, shown for two random 50/50 split samples of the data (left, right). Trends in the global structure are similar across subsamples, indicating good group stability, but the PTE group differences are not captured by PCA. (D) Like (C), but with a UMAP reduction of the synthetic data set down to two dimensions. Trends in the global structure are broadly similar, and the PTE phenotype is distinct. (E) Phenotypes are shown in a radial plot broken out across the five clusters found by UMAP embedding in (D). PCA, principal component analysis; UMAP, uniform manifold approximation and projection. Color image is available online.

