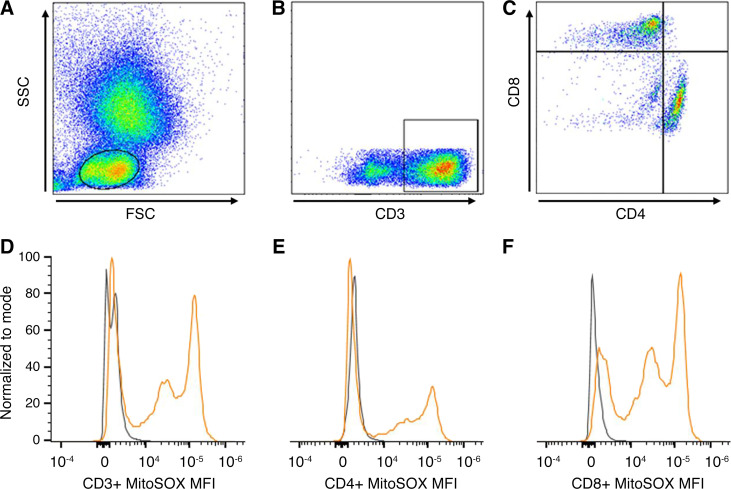
Figure 1.
The top panel shows an example of flow cytometry gating strategy to isolate lymphocytes (A), which can be differentiated further into T cells by their CD3 positivity (B). From the total T cells, T-helper cells can be identified by their CD4 positivity (C) and T-cytotoxic cells from their CD8 positivity (C). The bottom panel shows sample flow cytometry plots representing the median MitoSOX fluorescence intensity (MFI) of one healthy nondepressed adult (gray) and one otherwise healthy young adult with major depressive disorder (orange) in total T cell (CD3+; D), T-helper cells (CD4+; E), and T-cytotoxic cells (CD8+; F).

