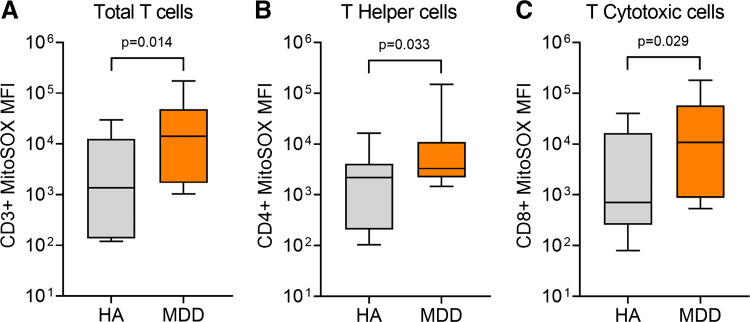
Figure 2.
Box (median, 25th and 75th percentiles) and whisker (5th and 95th percentiles) plot showing group differences in MitoSOX median fluorescence intensity (MFI) between healthy nondepressed adults in gray plots [HA, n = 11 (6 males/5 females)] and otherwise healthy young adults with major depressive disorder in orange plots [MDD, n = 14 (4 males/10 females)] for total T cell (CD3+; A), T-helper (CD4+; B), and T-cytotoxic (CD8+; C) cells. Data were analyzed using the Mann–Whitney U test.

