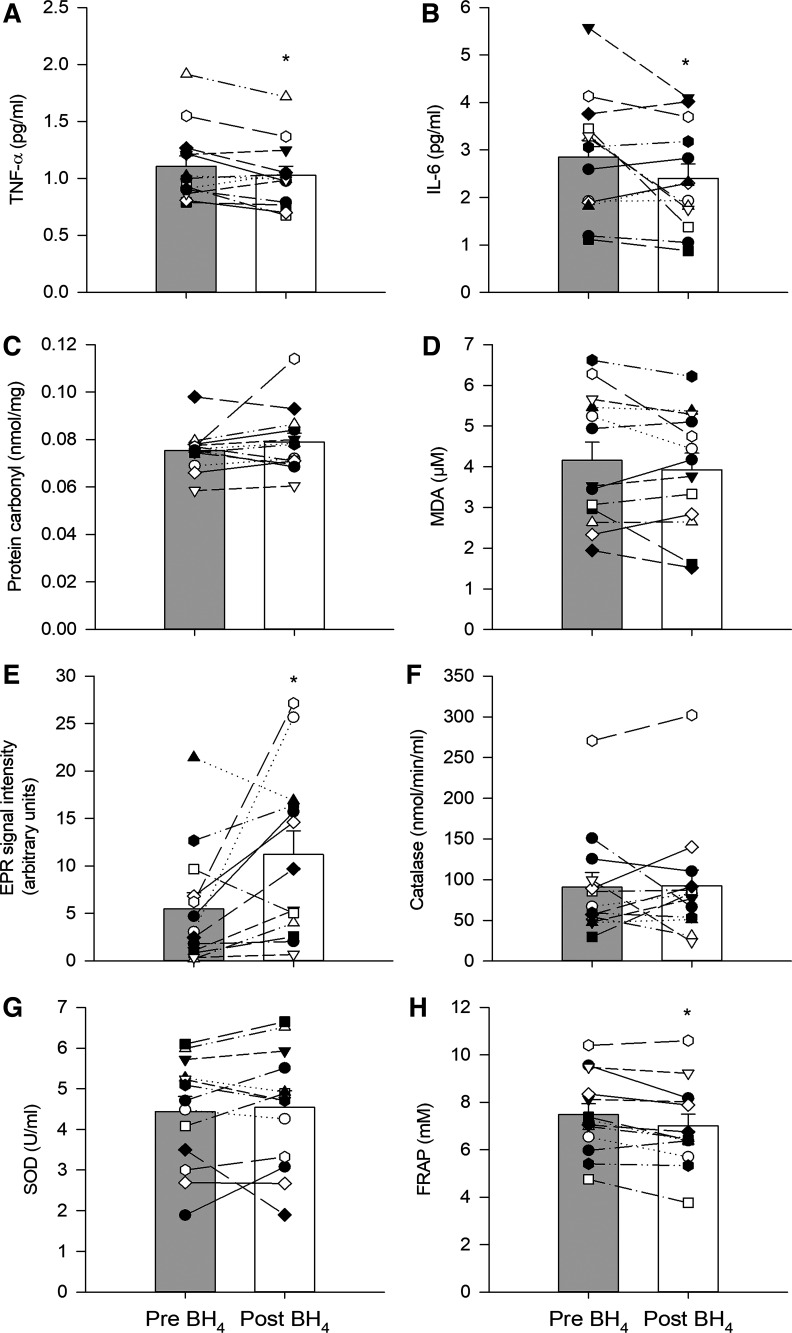
Figure 3.
Blood biomarkers, from Protocol 2, of inflammation [tumor necrosis factor-α (TNF-α), A; and interleukin 6 (IL-6), B; oxidative stress (protein carbonyl), C; and malondialdehyde (MDA), D; free radicals (electron paramagnetic resonance, EPR, signal intensity), E; endogenous antioxidant capacity (catalase activity), F; and superoxide dismutase (SOD), G; and total antioxidant capacity (ferric reducing ability of plasma, FRAP), H]. Initial blood biomarker data are labeled as pre BH4 intake (gray bars) while 4.5 h after acute BH4 supplementation (10 mg/kg), blood biomarkers are labeled as post BH4. Figure 3 sample size is 12 (8 M/4F). The effect of BH4 supplementation, within each protocol, was tested with paired Student’s t test. Data presented as means ± SE. *P< 0.05 different from pre.

