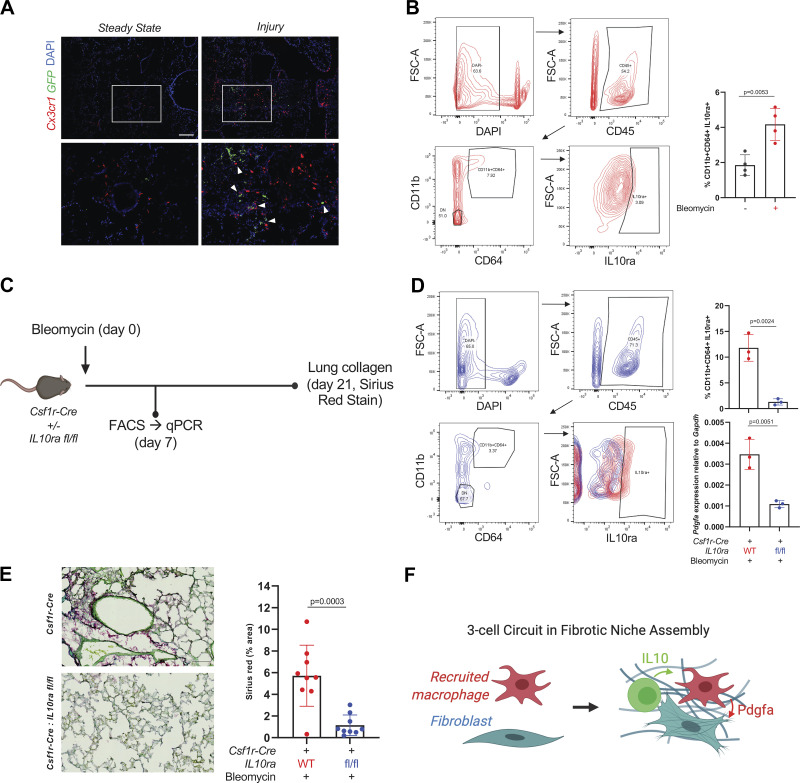
Figure 4.
IL10-expressing cells localize to moMacs after lung injury and induce Pdgfa expression. A: immunofluorescence of lung sections from Cx3cr1-CreERT2: R26-LSL-TdTomato: IL10-GFP mice at steady state and 7 days after injury with bleomycin. Magnified regions of interest are shown in the lower panels, with arrowheads marking sites of colocalization of Cx3cr1+ and IL10-expessing cells. Scale bar = 50 µm. Data are representative of n = 4 mice for injured and n = 2 mice for steady state. B: representative flow cytometry for IL10ra in CD11b+CD64+ moMacs from WT mice 7 days after bleomycin injury. Quantitation is for percentage of IL10ra+ moMacs at steady state and 7 days after bleomycin (n = 4 mice/group). P value is for two-sided Student’s t test. C: experimental design for IL10ra deletion with Csf1r-Cre used for D and E. D: representative flow cytometry for IL10ra in CD11b+CD64+ moMacs after bleomycin injury in Csf1r-Cre: IL10ra fl/fl mice (blue) or Csf1r-Cre controls (red). Quantitation is for percentage of IL10ra+ moMacs (top) and for qPCR for Pdgfa expression in sorted CD11b+CD64+ moMacs from WT and KO mice (bottom; n = 3 mice/group). P values are for two-sided Student’s t tests. E: representative image from Sirius Red staining of lungs at 21 days after bleomycin in Csf1r-Cre: IL10ra fl/fl mice (bottom) or Csf1r-Cre controls (top). Quantitation is for three separate images for each mouse (n = 3 mice/condition). P value shown is for two-sided Student’s test. Scale bar = 100 µm. F: schematic of cell-cell interaction in the fibrotic niche. KO, knockout; moMacs, monocyte-derived macrophages; scRNA-Seq, single-cell RNA-Seq; WT, wild-type. [C and F were created with BioRender.com.]

