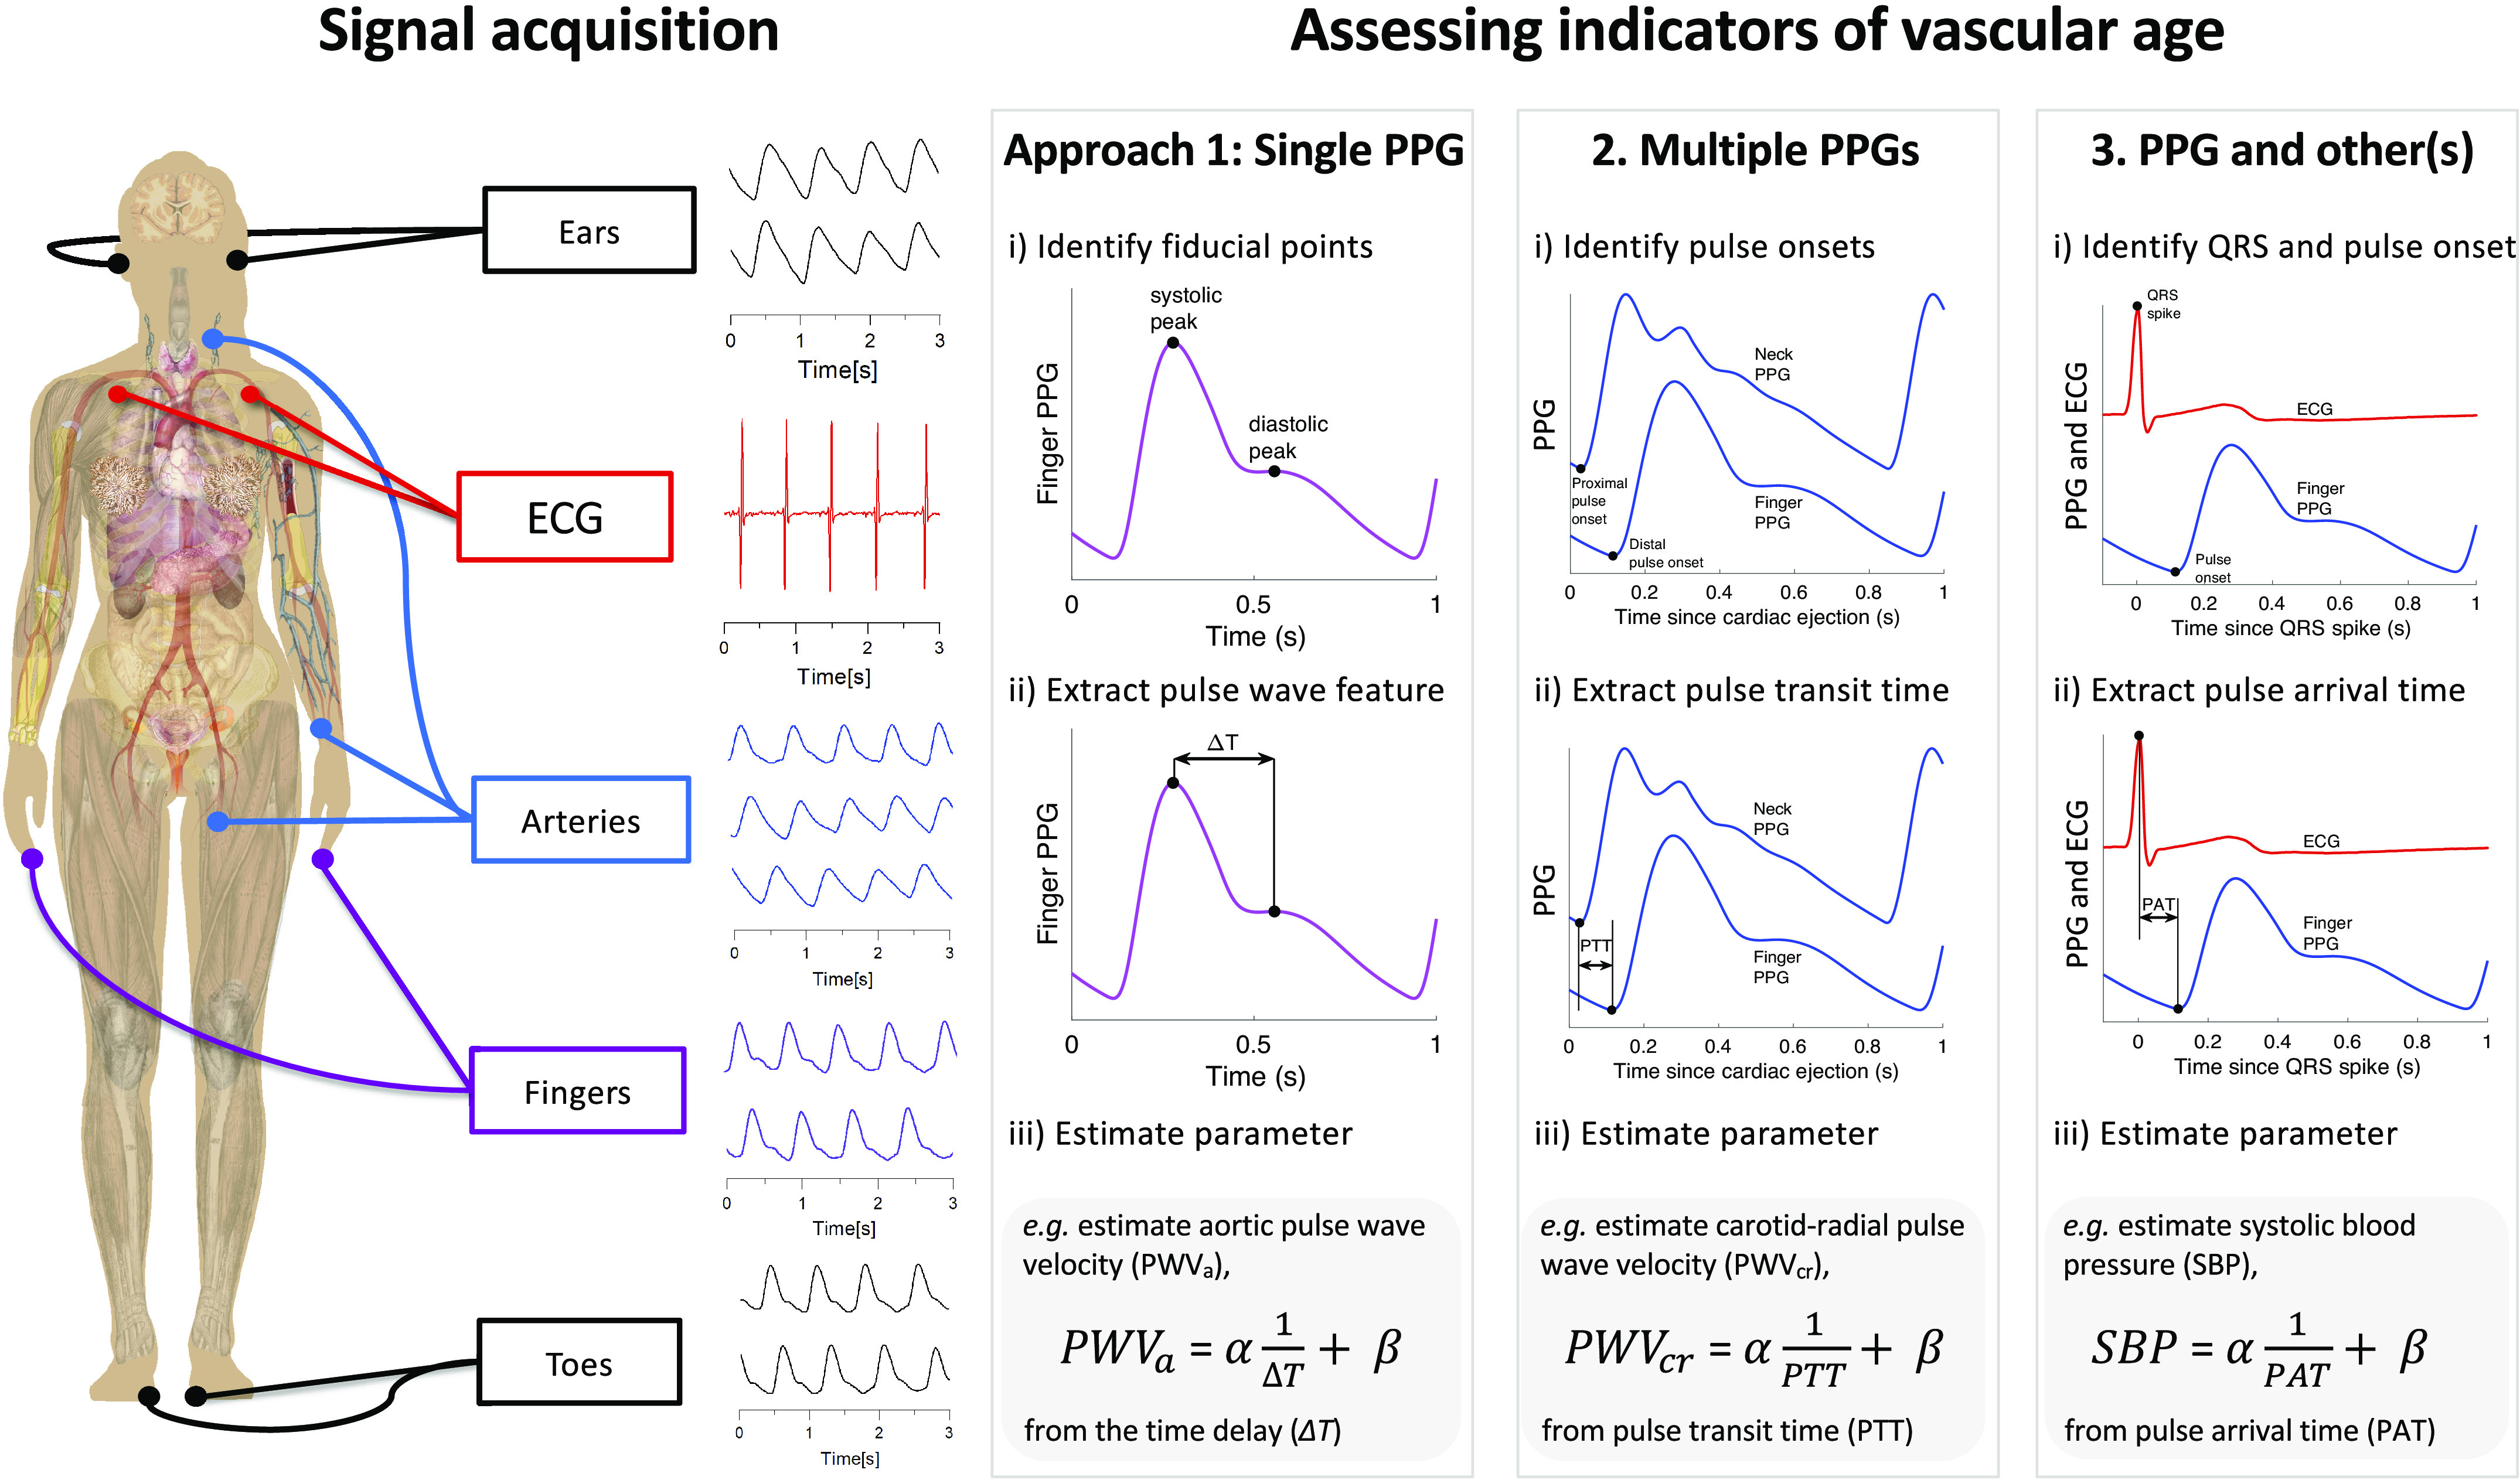
Figure 3.

Three approaches for assessing indicators of vascular age from the photoplethysmogram (PPG): Signal(s) are acquired from single or multiple sites (left). One of three approaches is then used to derive a parameter of vascular age from the following signals: 1) a single PPG, 2) multiple PPGs, or 3) PPG and other(s). An example of a regression equation for assessing an indicator of vascular age is provided for each approach: i) estimating aortic pulse wave velocity from the time delay between systolic and diastolic peaks on a PPG pulse wave; ii) estimating carotid-radial pulse wave velocity from the pulse transit time (PTT) between PPG pulse waves measured at different sites; iii) estimating systolic blood pressure from the pulse arrival time (PAT) between the QRS spike of an ECG signal, and the arrival of a PPG pulse wave at the finger. ECG, electrocardiogram; α and β, linear regression coefficients obtained during a calibration procedure. Sources: Mikael Häggström, Female shadow anatomy without labels (“https://commons.wikimedia.org/wiki/File:Female_shadow_anatomy_without_labels.png”) (public domain); “signal acquisition” signals—Institute of Biophysics, University of Belgrade; remaining PPG signals—the Pulse Wave Database under ODC PDDL v.1.0 (https://opendatacommons.org/licenses/pddl/1-0/) (4).
