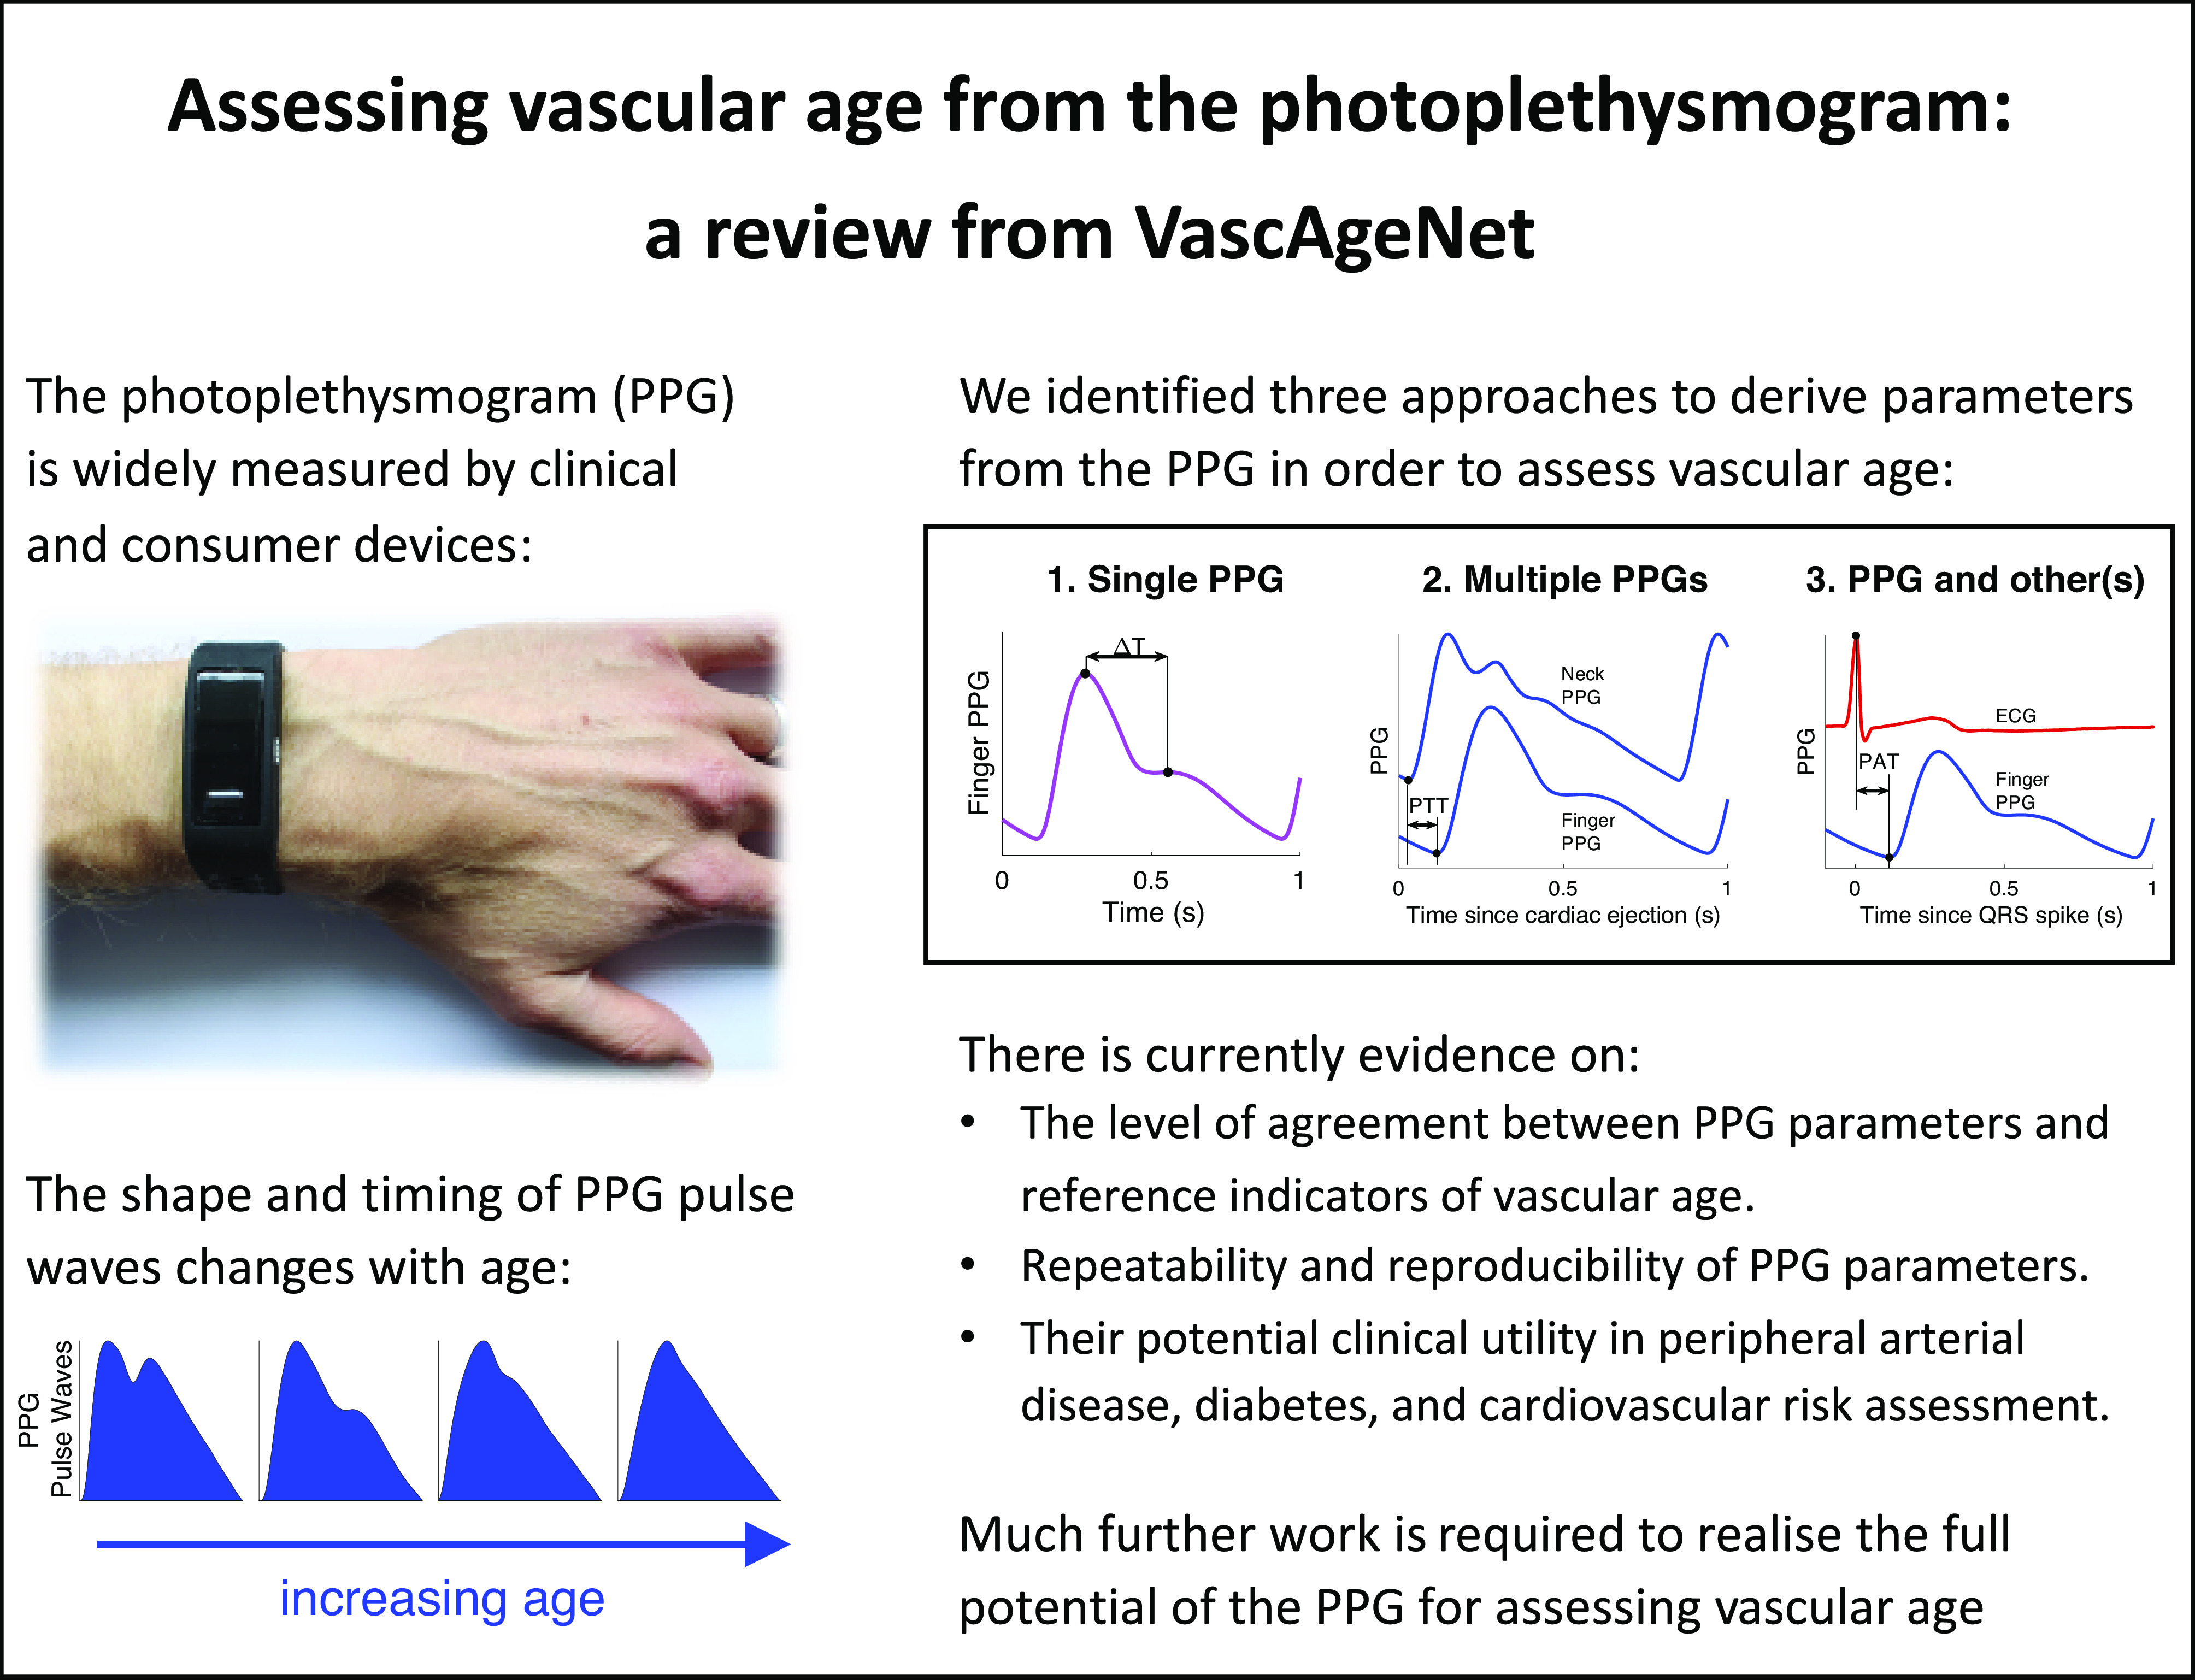
Figure 6.

A graphical summary of the key conclusions. Wristband adapted from P. H. Charlton, “Max Health Band” (CC BY 4.0). Pulse waves adapted from: P. H. Charlton, “Classes of photoplethysmogram (PPG) pulse wave shape” (CC BY 4.0).

A graphical summary of the key conclusions. Wristband adapted from P. H. Charlton, “Max Health Band” (CC BY 4.0). Pulse waves adapted from: P. H. Charlton, “Classes of photoplethysmogram (PPG) pulse wave shape” (CC BY 4.0).