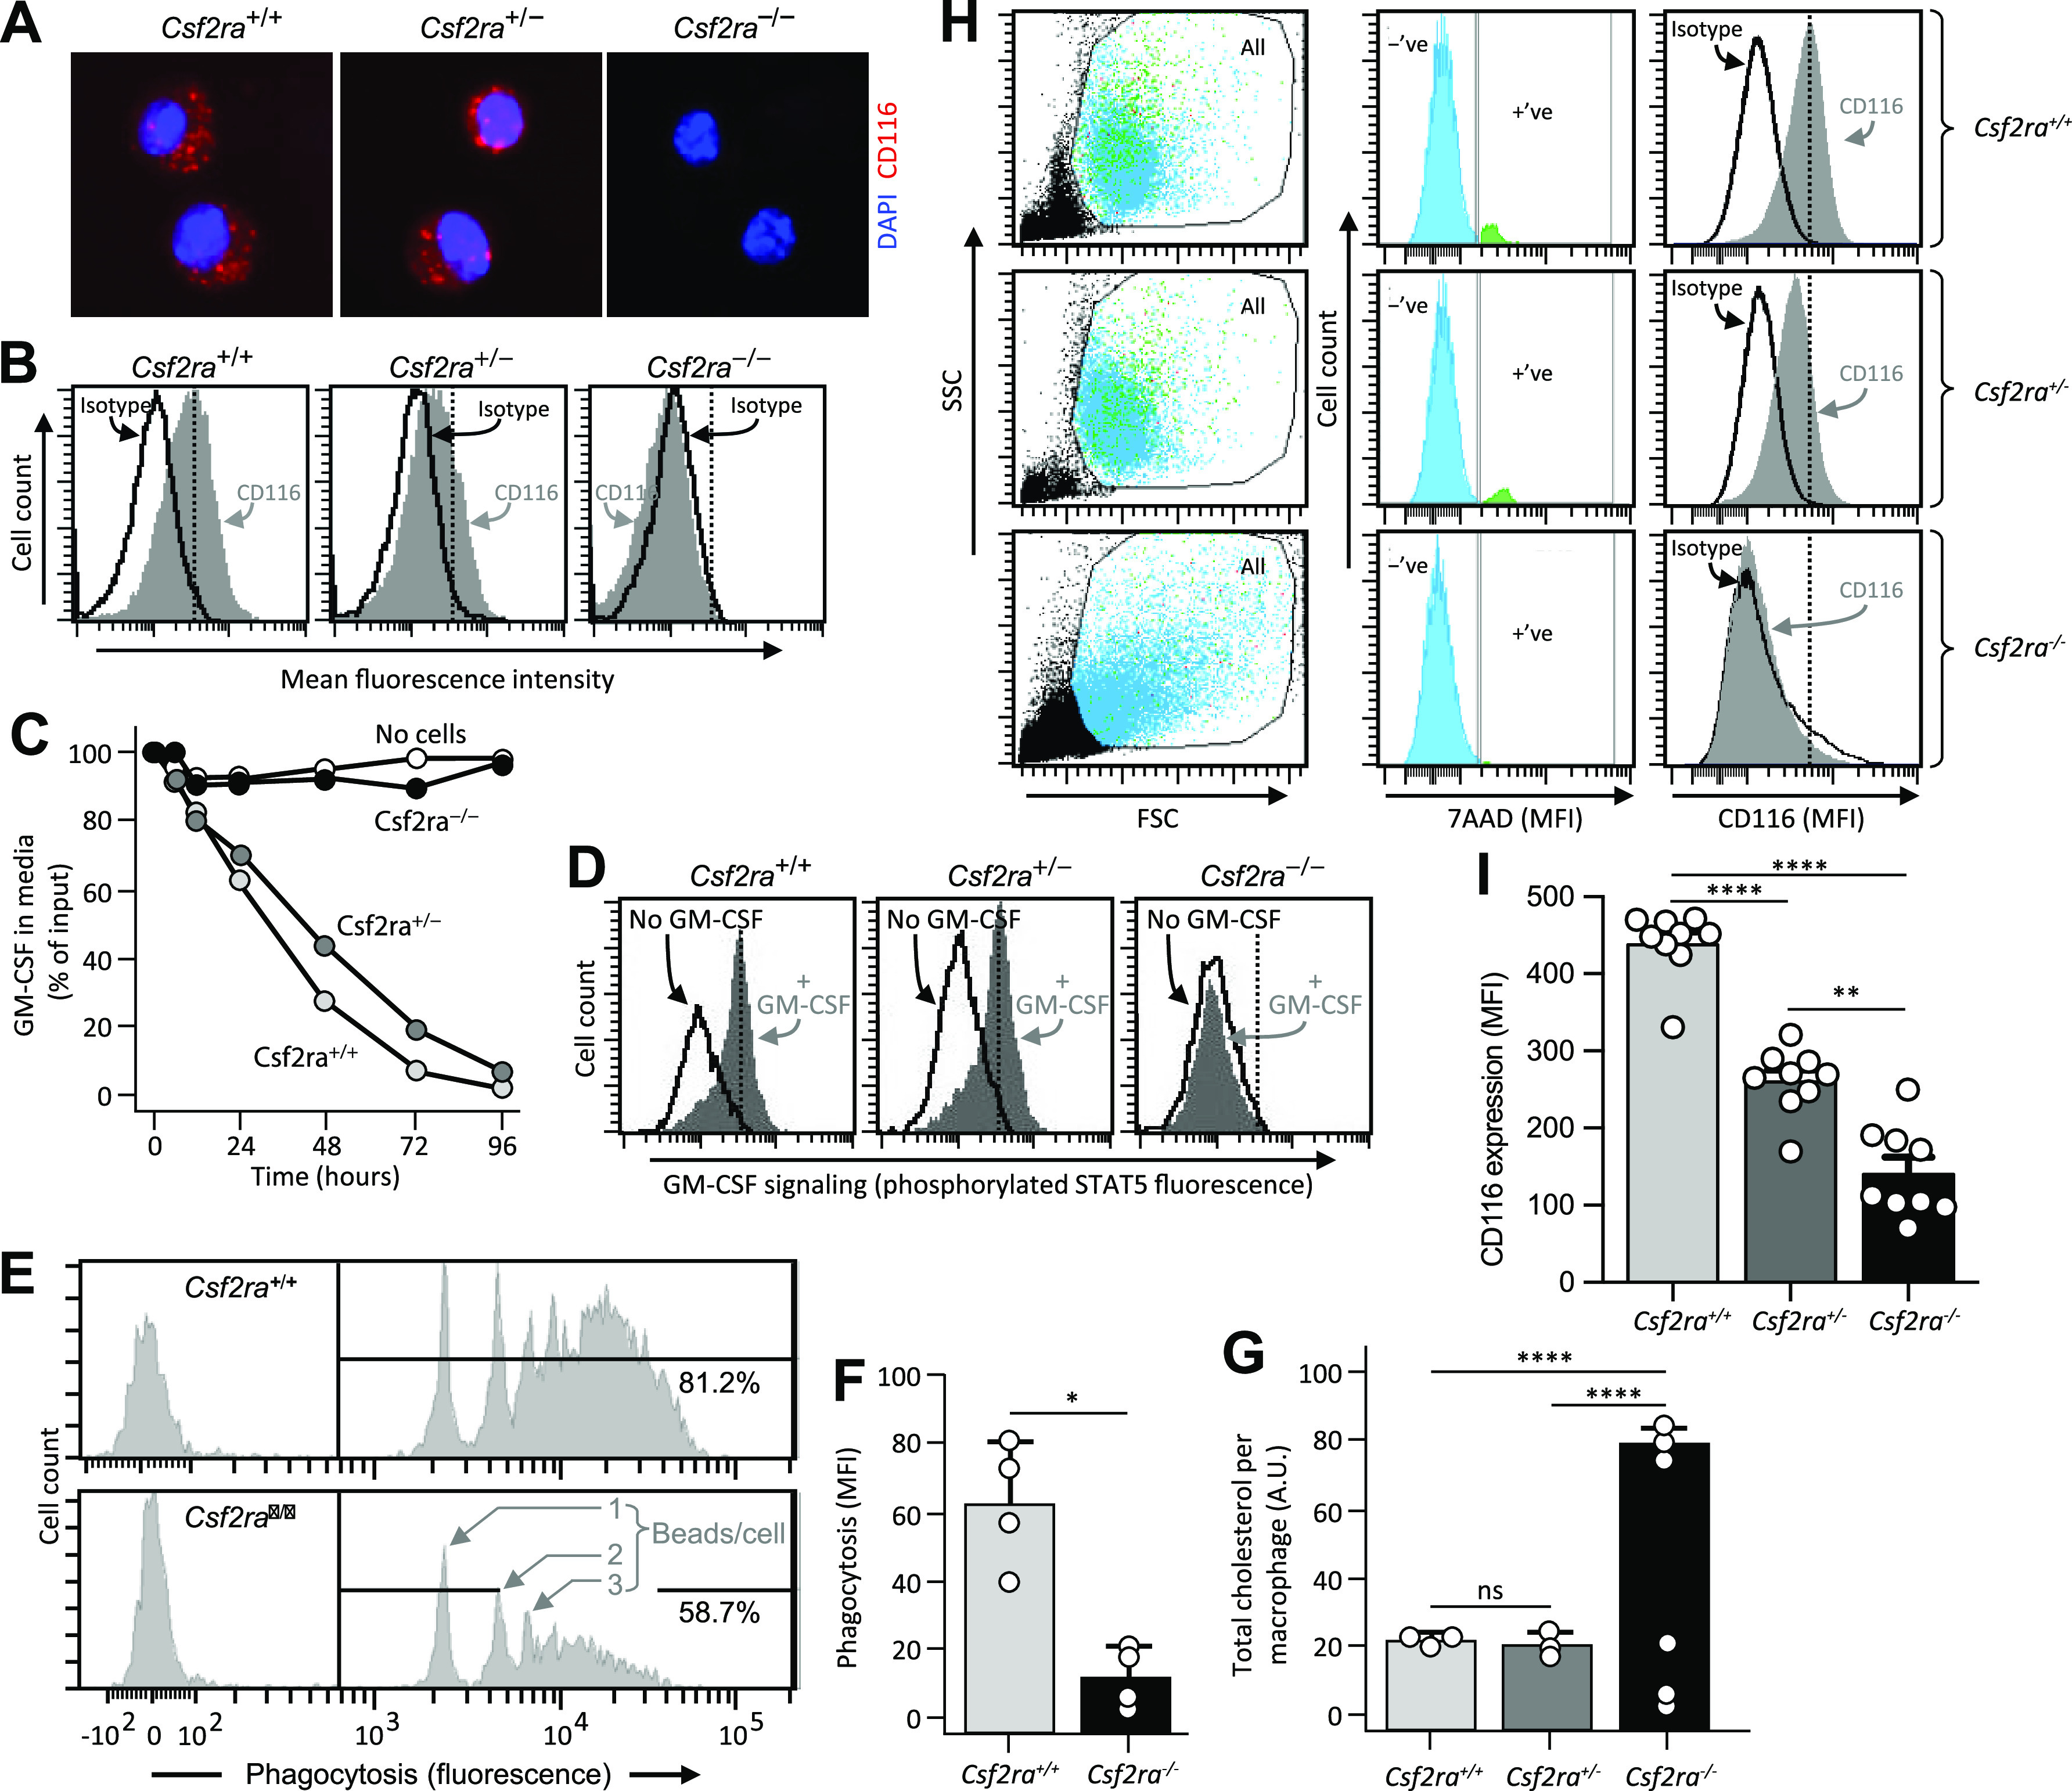
Figure 2.

Effects of Csf2ra gene disruption on macrophage functions. A: photomicrographs showing immunofluorescence indicating the presence of the granulocyte/macrophage-colony stimulating factor (GM-CSF) receptor α subunit (CD116) on alveolar macrophages (AMs) from age-matched Csf2ra+/+ and Csf2ra+/− but not Csf2ra–/– mice. B: detection of CD116 by flow cytometry on bone marrow-derived macrophages (BMDMs) from age-matched Csf2ra+/+ and Csf2ra+/− but not Csf2ra–/– mice after staining with isotype control antibody or anti-CD116 antibody (indicated). C: macrophage-mediated binding and clearance of GM-CSF. BMDMs from the indicated mouse lines were cultured in medium to which GM-CSF had been added without further media changes and at the indicated times media aliquots were obtained and the concentration of GM-CSF was measured by ELISA. Three separate plates were evaluated at each condition and time point. D: GM-CSF receptor signaling. BMDMs from the indicated mouse lines were evaluated for GM-CSF receptor signaling by incubation without or with GM-CSF (10 ng/mL) to stimulate phosphorylation of signal transducer and activator of transcription (STAT5) measured by flow cytometry as described (10). E and F: Fc-receptor mediated phagocytosis. BMDMs were incubated with opsonized beads (2-μm diameter fluorescent microspheres coated with bovine serum albumin (BSA) bound by anti-BSA antibodies) for 1 h and internalization was measured by flow cytometry. E: histograms showing peaks of fluorescence corresponding to 1, 2, or 3, … beads/cell. The percentage of cells internalizing fluorescent beads is shown numerically. F: phagocytosis was quantified as the means ± SE mean fluorescence intensity from four measurements per condition. *P < 0.05. G: surfactant clearance. BMDMs in culture were incubated for 24 h with pulmonary alveolar proteinosis (PAP) patient-derived surfactant sediment (from whole lung lavage), then for 24 h in media without added surfactant to allow cells to clear the internalized surfactant phospholipids, cholesterol, and proteins, and then the retained intracellular cholesterol ester was measured by Amplex Red assay and expressed after normalization to cellular protein from three measurements per condition. H and I: evaluation of CD116 expression on AMs from age-matched Csf2ra+/+, Csf2ra+/–, and Csf2ra–/– mice by flow cytometry. H, Left: scatterplots showing side scatter (SSC) versus forward scatter (FSC) and the gating strategy used to identify cells (All) and exclude noncell debris. H, Middle: histogram plots and gating strategy used to identify cells with positive (+ve) or negative (−ve) 7AAD-antibody staining. H, Right: histogram plots showing 7AAD-negative cells (determined from the gate shown in central panels) that were stained with isotype control antibody or anti-CD116 antibody (indicated). I: CD116 expression on AMs was quantified as means ± SE mean fluorescence intensity from 8 to 9 mice/group. **Significant P < 0.01, ****P < 0.0001.
