Figure 6.

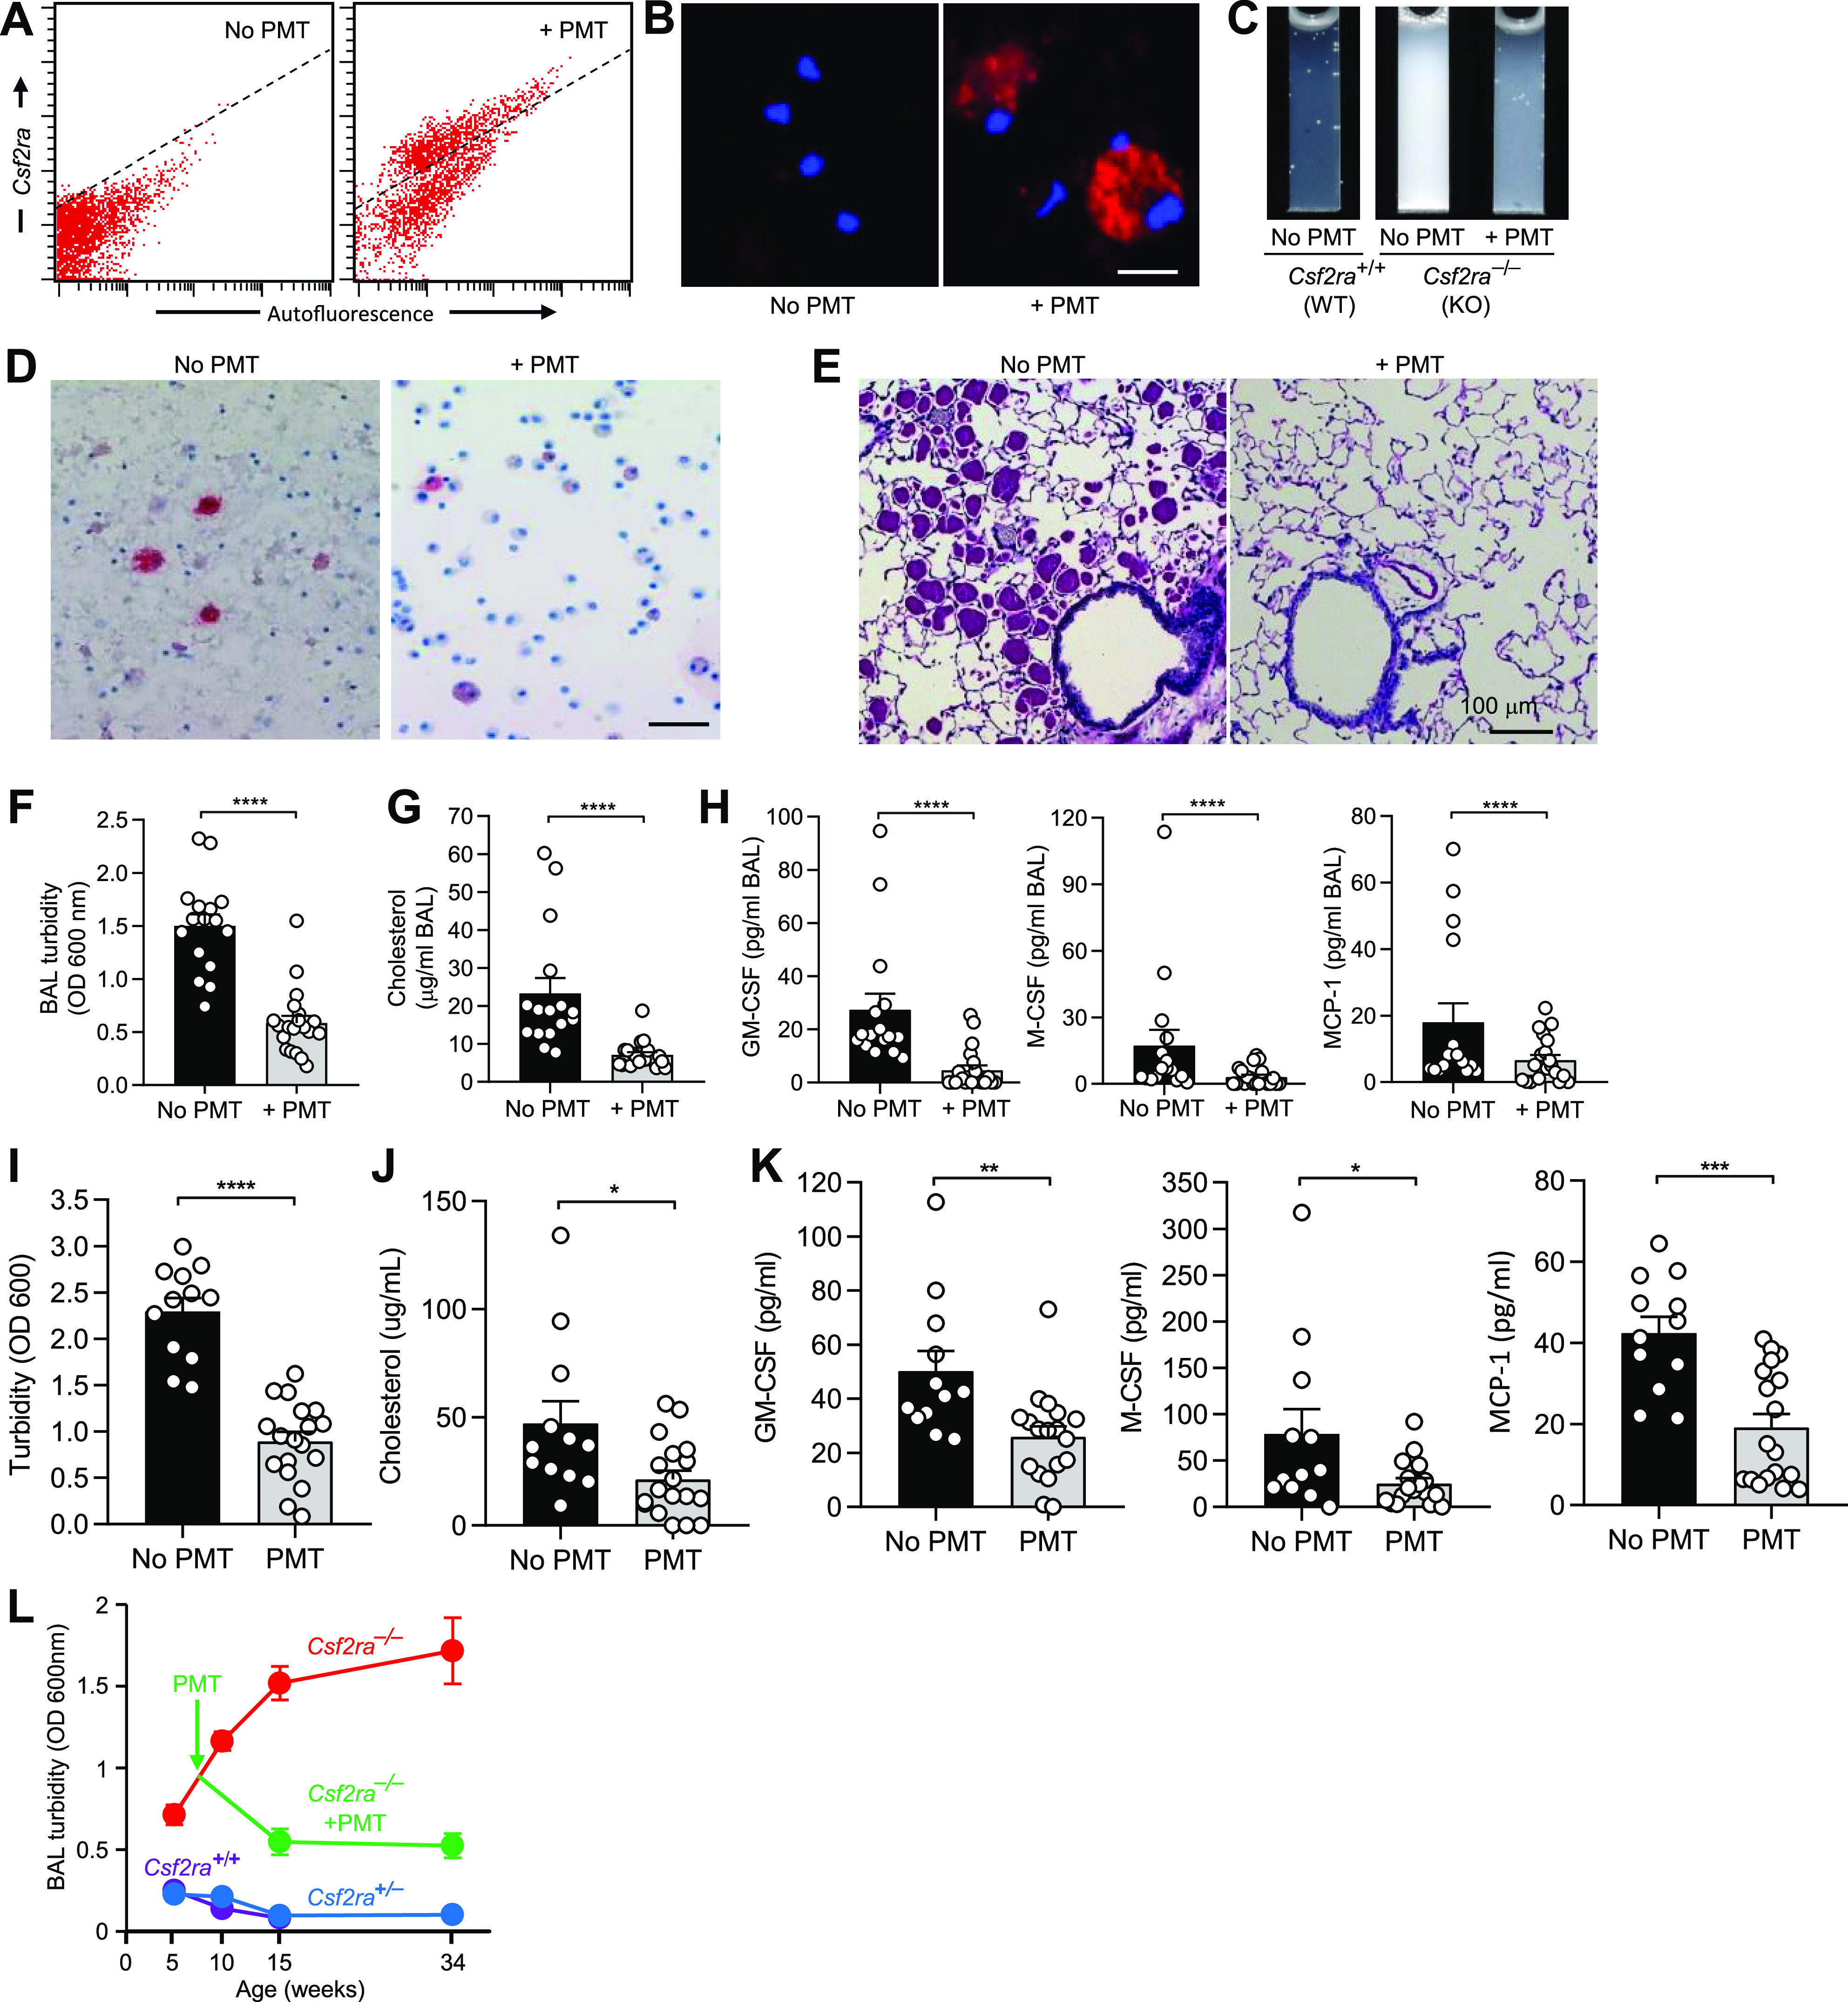
Effects of pulmonary macrophage transplantation (PMT) on granulocyte/macrophage-colony stimulating factor (GM-CSF) signaling and functions of the alveolar macrophage (AM) population in Csf2ra–/– mice to identify the cellular site of disease in Csf2ra–/– mice. Age-matched Csf2ra–/– mice without/with PMT Csf2ra+/+ donor cells were evaluated at subsequent times to characterize the lung phenotype. A: engraftment of transplanted macrophages measured 2 mo after PMT by flow cytometric detection of CD116-positive cells (above dotted line) in PMT-treated mice (right); only autofluorescence was detected in mice without PMT (below dotted line). B: evaluation for expression of CD116 (red color) and counterstaining to detect DAPI nuclear counterstaining (blue color) on AMs in age-matched Csf2ra–/– mice without/with PMT after 2 mo. Scale bar = 20 µm. C: gross appearance of BAL fluid 2 mo after PMT in age-matched, untreated (No PMT) Csf2ra+/+ or Csf2ra–/– mice and PMT-treated (+PMT) Csf2ra–/– mice. D: bronchoalveolar lavage (BAL) cytology after 2 mo in untreated (No PMT) and PMT-treated (+PMT) Csf2ra–/– mice. Oil-red-O stain. Scale bar = 100 µm. E and F: effect of PMT on lung disease severity. E: representative lung histology after 2 mo in Csf2ra–/– mice that were untreated or PMT-treated. Periodic acid-Schiff stain. F: BAL turbidity after 2 mo in age-matched Csf2ra–/– mice without (16 mice/group) or with PMT (20 mice/group). G: BAL cholesterol after 2 mo in age-matched Csf2ra–/– mice without (16 mice/group) or with PMT (20 mice/group). H: hereditary pulmonary alveolar proteinosis (PAP) BAL biomarkers [granulocyte/macrophage-colony stimulating factor (GM-CSF), M-CSF, and monocyte chemoattractant protein (MCP)-1] after 2 mo in age-matched Csf2ra–/– mice without (16 mice/group) or with (20 mice/group) PMT. I–K: BAL turbidity, cholesterol, or PAP cytokine biomarkers, respectively, after 6 mo in age-matched Csf2ra–/– mice without (12–16 mice/group) or with (18–20 mice/group) PMT. L: BAL turbidity at various times in age-matched Csf2ra–/– mice without or with PMT. The numbers of mice at risk at each time point were [genotype, treatment; age (wk)—number of mice]: Csf2ra–/–, untreated; 5 wk—16, 10 wk—22, 16 wk—23, 34 wk—12; Csf2ra–/–, PMT-treated; 16 wk—16, 34 wk—16; Csf2ra+/+, untreated; 5 wk—15, 10 wk—16, 16 wk—7; Csf2ra+/−, untreated; 5 wk—23, 10 wk—16, 16 wk—15, 34 wk—8. Scale bar = 100 µm. *P < 0.05, **P < 0.01, ***P < 0.001, ****P < 0.0001.
