Figure 2.

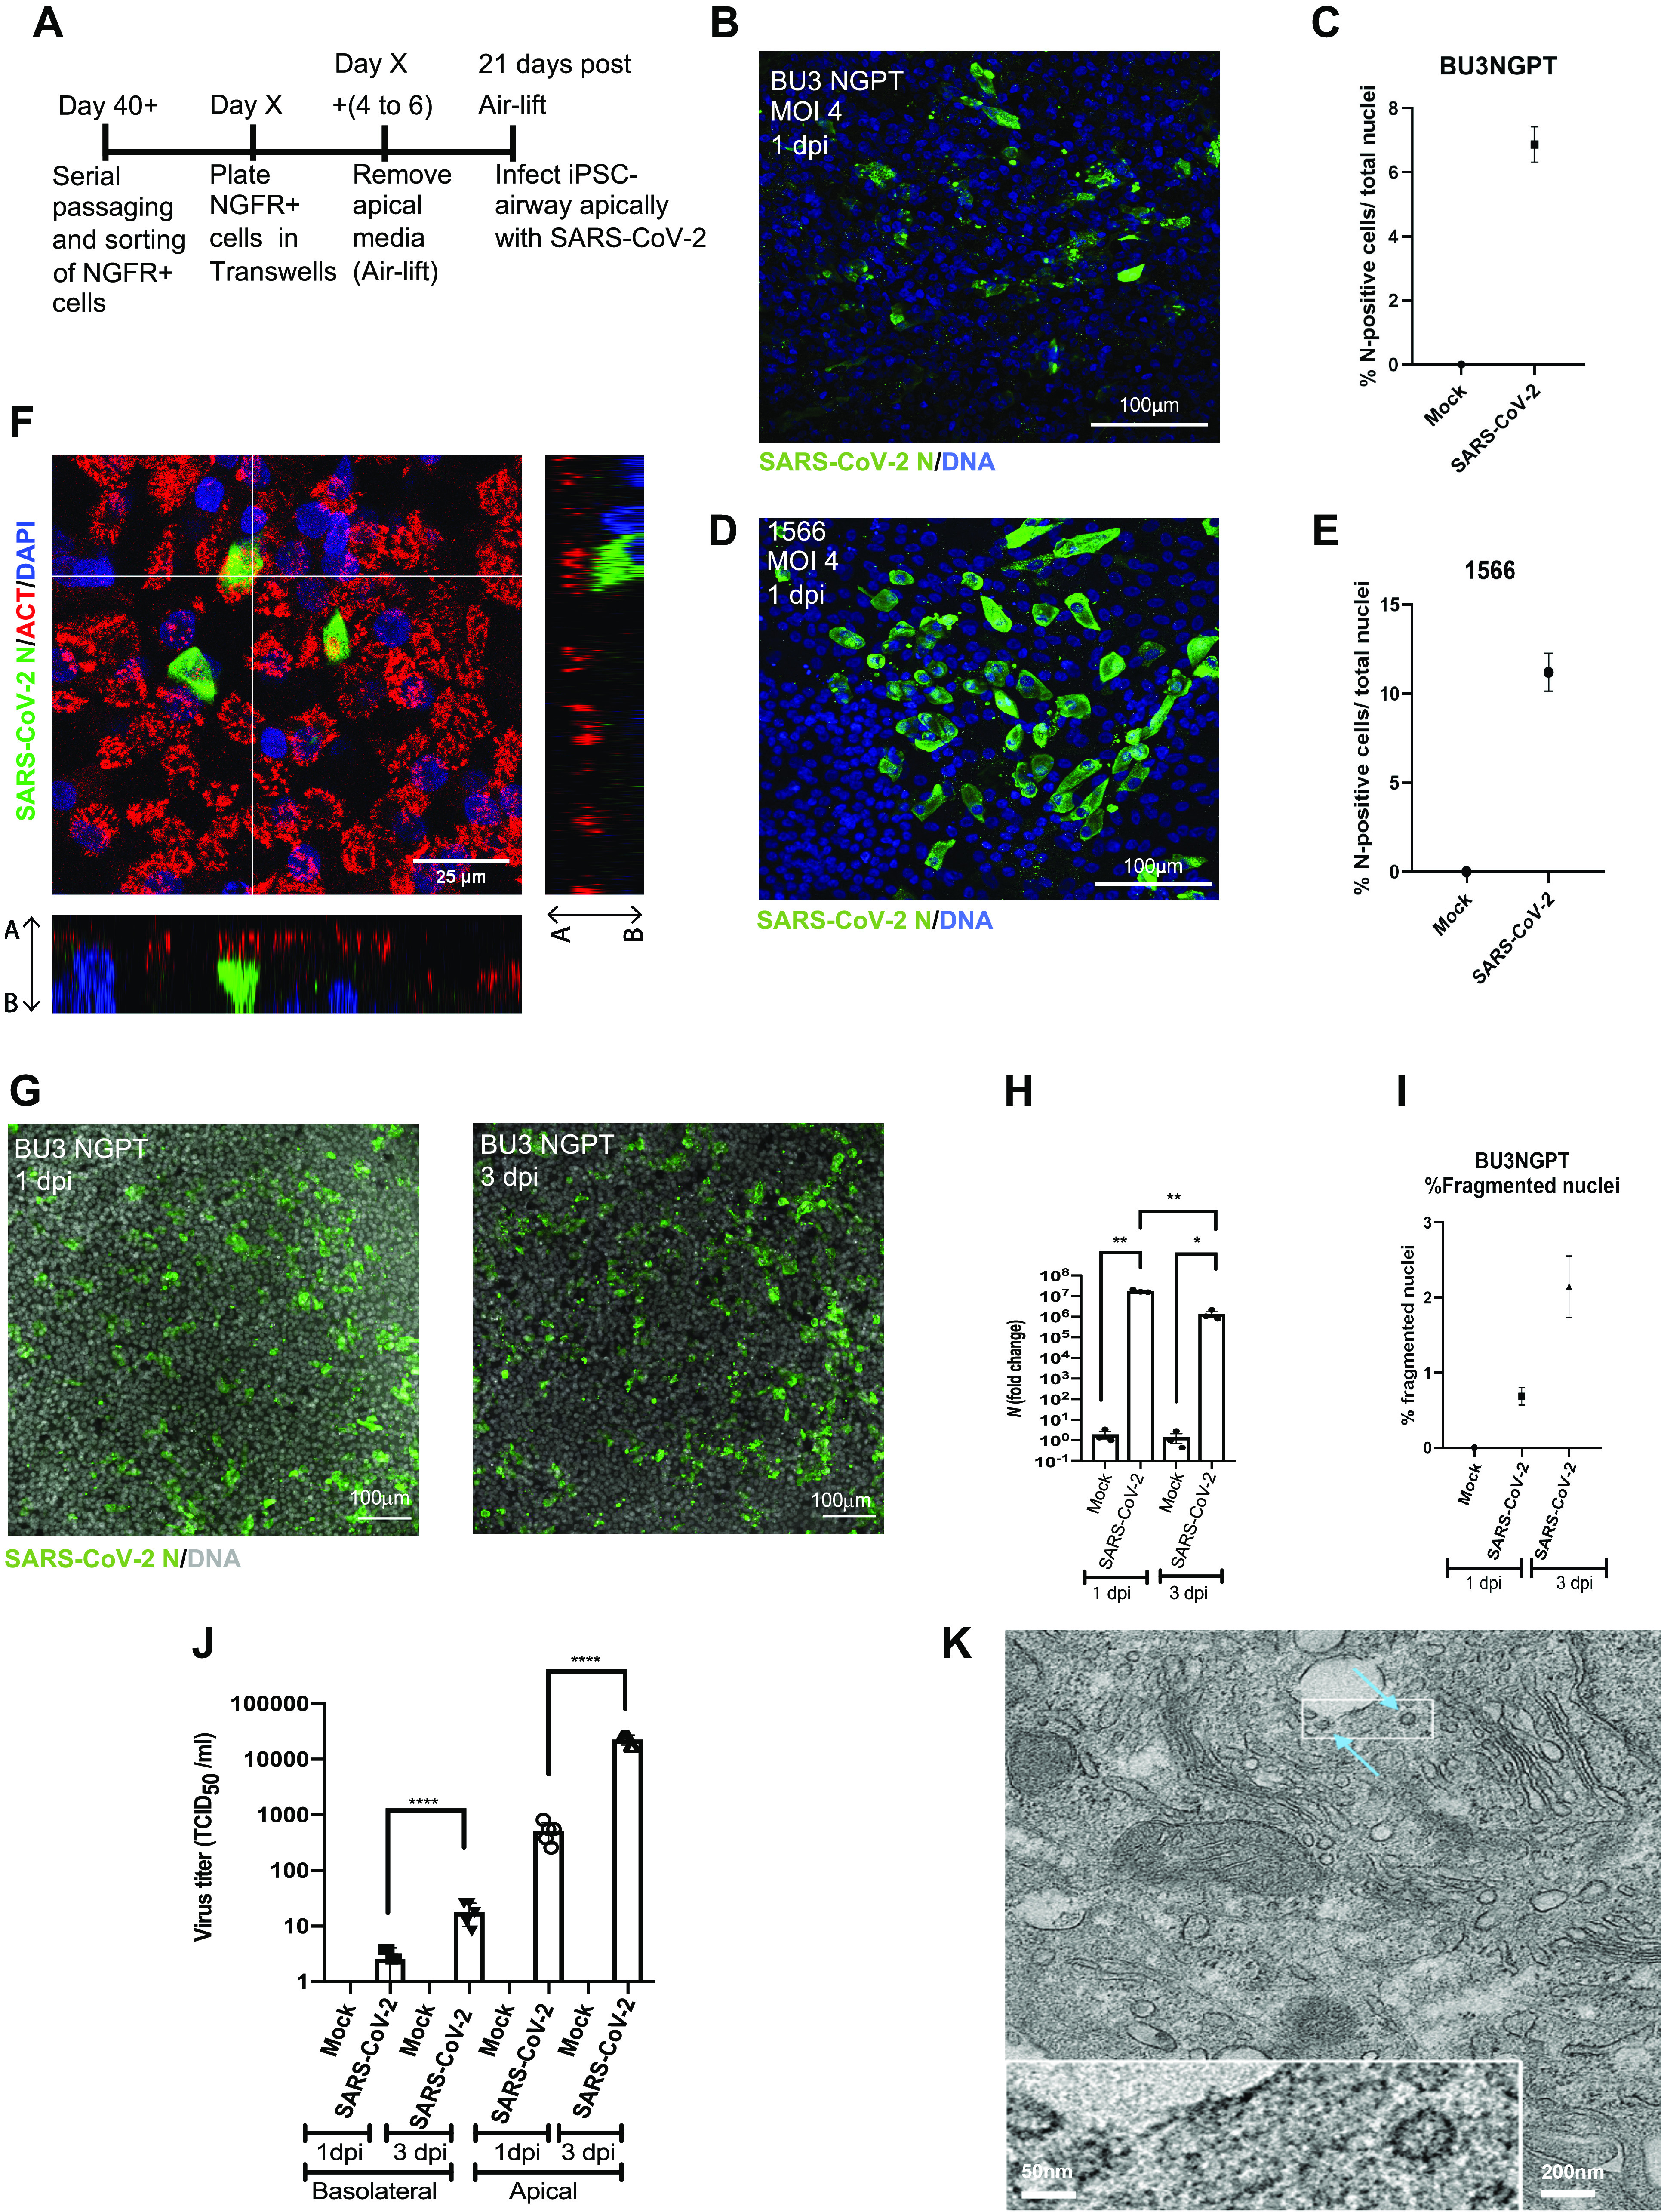
iPSC-derived airway is permissive to SARS-CoV-2 infection with time-dependent restriction in viral growth. A: schematic of the protocol to iPSC airway with SARS-CoV-2. B–E: immunofluorescence and quantification of viral nucleoprotein+ (SARS-CoV-2 N, green) cells in BU3 NGPT (B and C) and 1566 (D and E) cells at 1 dpi (×40, scale bar = 100 µm). BU3 NGPT mean nucleoprotein+ cells = 6.87 ± 0.548% (SE). 1566 mean nucleoprotein+ cells = 11.21 ± 1.075% (SE). F: confocal immunofluorescence microscopy of BU3 NGPT with antibodies against SARS-CoV-2 N positive (green) cells and α-TUBULIN (red). Nuclei are stained with DAPI (blue). G: immunofluorescence of infected iPSC airway (BU3 NGPT) at 1 and 3 dpi, labeled with anti-SARS-CoV-2 N antibody and nuclei labeled with DAPI (×20, scale bar = 100 µm). H: RT-qPCR of viral N gene expression of iPSC airway (BU3 NGPT) at 1 and 3 dpi (n = 3 Transwells per sample). Fold-change expression compared with mock (2−ddCt) after 18S normalization is shown. I: percentage of fragmented nuclei detected at 1 and 3 dpi in iPSC airway (BU3 NGPT) [1 dpi = mean 0.69 ± 0.12% (SE) and 3 dpi = mean 2.14 ± 0.32% (SE)]. J: viral titers from apical washes and basolateral media at 1 and 3 dpi from iPSC airway (BU3 NGPT) compared with mock. K: transmission electron micrograph of SARS-CoV-2-infected iPSC airway (1566) at 1 dpi. Blue arrows indicate viral particles (scale bar = 200 nm, 50 nm in enclosed box). Statistical significance was determined as P value of <0.05 using Student’s t test (*P ≤ 0.05; **P ≤ 0.01; ***P ≤ 0.001; ****P ≤ 0.0001). iPSC, induced pluripotent stem cell.
