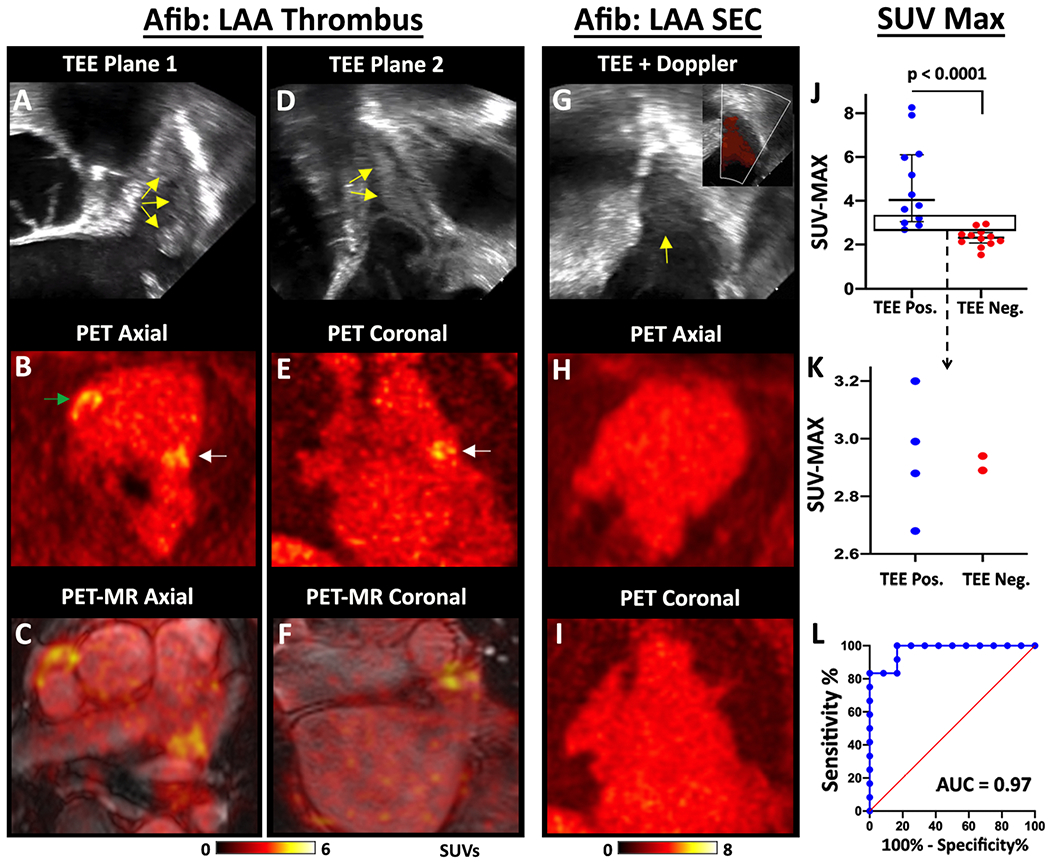
Figure 2. Detection of spontaneous thrombi in the LAA.

TEE, PET and fused PET/MRI images of a subject with multiple LAA thrombi are shown in two orthogonal planes, (A-C) and (D-F). The thrombi produce echogenic/bright foci (yellow arrows) on the TEE images (A, D). The PET (B, E) and PET/MRI (C, F) images reveal multiple foci of [64Cu]FBP8 uptake in the LAA (white arrows) in both planes. In addition, thrombus is also identified in the RAA (green arrow). (G-I) [64Cu]FBP8 does not accumulate in the LAA in a subject with spontaneous echo contrast (SEC) but no thrombus. (G) Echogenic signal is seen within the LAA (yellow arrow), but color Doppler (inset) reveals extensive flow consistent with SEC. No evidence of LAA thrombus is seen on the [64Cu]FBP8 PET images in the axial (H) or coronal (I) views. (J-L) The maximum SUV value in the LAA (SUVMAX) accurately distinguishes TEE positive and negative subjects. (J) SUVMAX in the TEE positive subjects was significantly higher than the TEE negative subjects. (J-K) A SUVMAX threshold of 2.6 correctly classified all (12/12) TEE positive subjects and 10/12 TEE negative subjects. The area in the rectangle in panel J is magnified in panel K and confirms that a SUVMAX threshold of 2.6 produces no false negative and only 2 false positive cases. (L) Receiver operating characteristic (ROC) curve demonstrates the robustness of [64Cu]FBP8 SUVMAX in distinguishing TEE positive and negative subjects, with an area under the curve (AUC) of 0.97.
