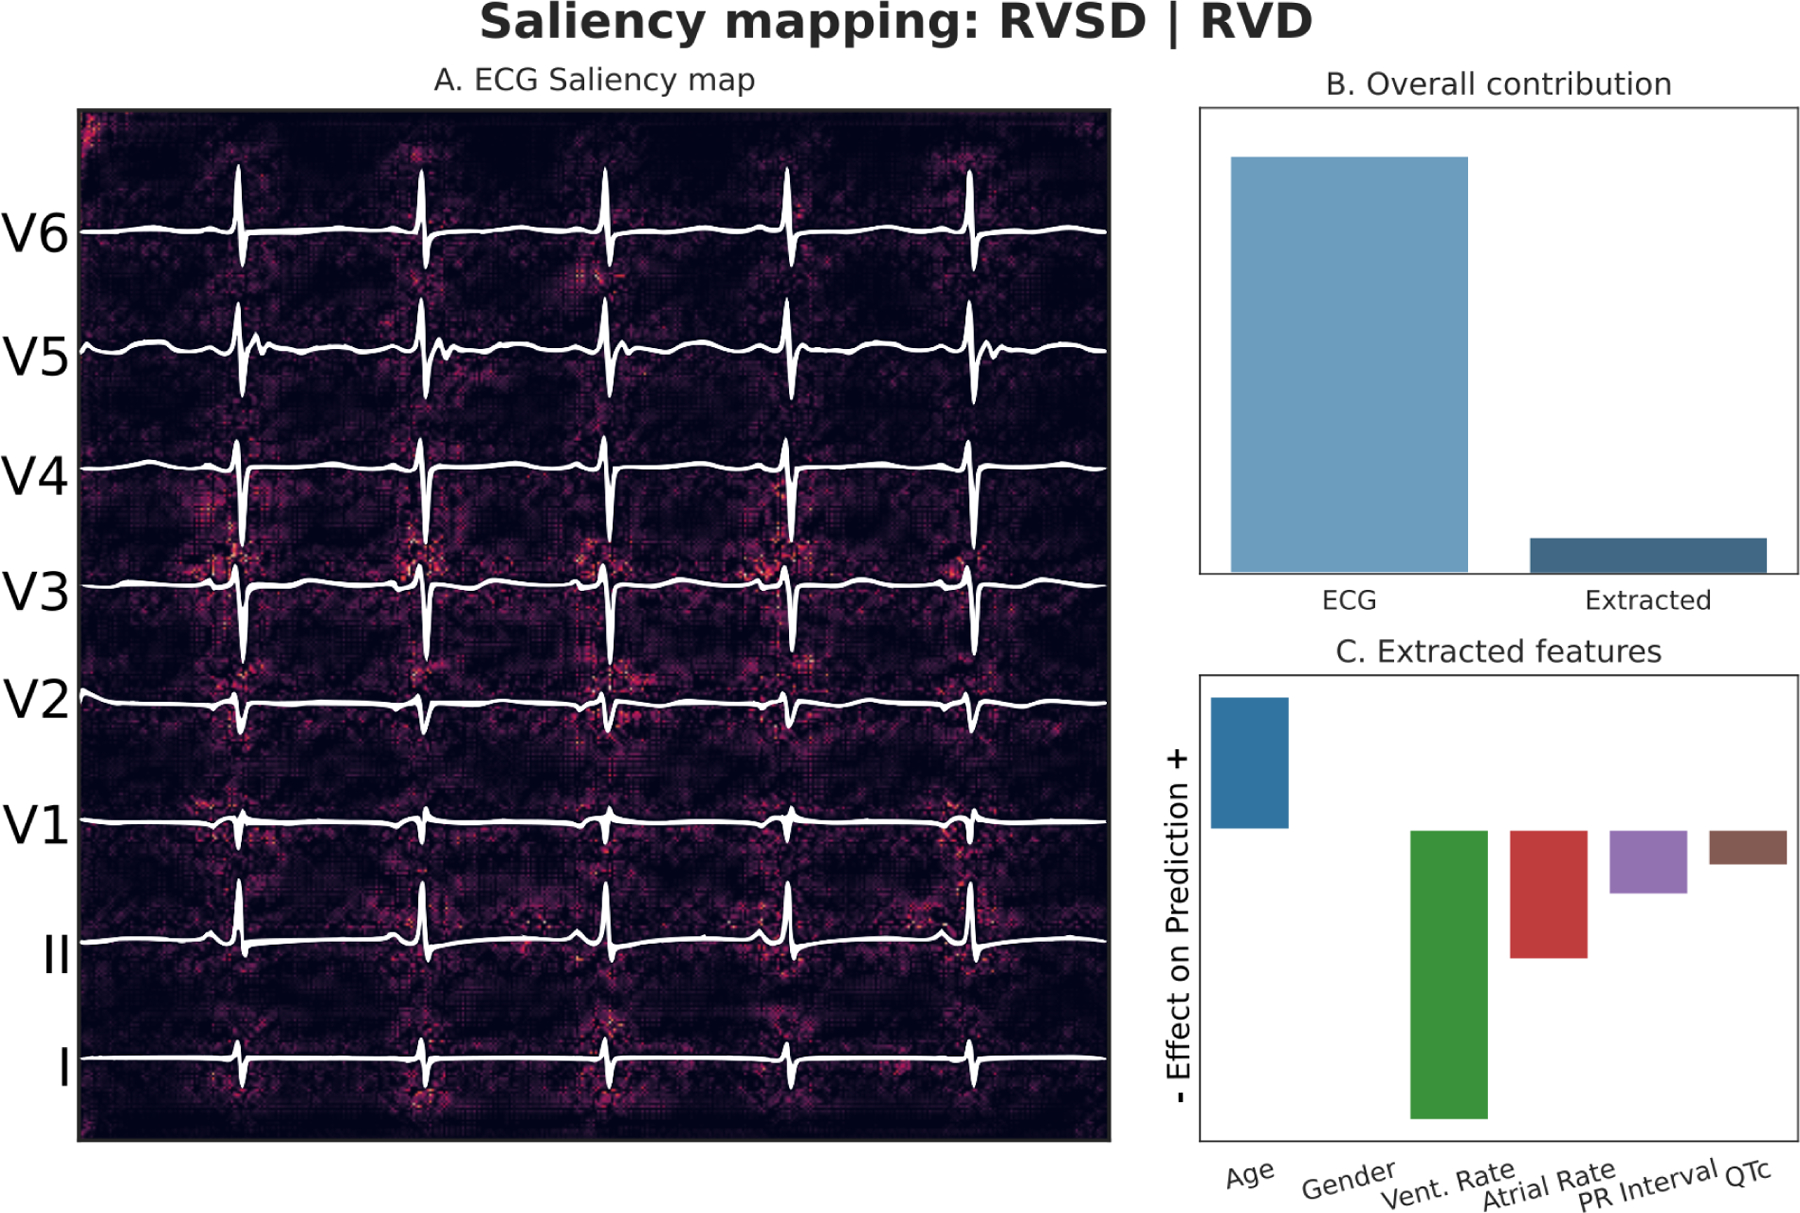
Figure 7: RV Composite Outcome (RVSD or RVD) Explainability.

Panel A: Pixels of input image which were most responsible for driving the prediction towards the composite outcome are highlighted. Panel B: Relative contributions of imaging data and tabular data to the overall prediction. Panel C: Effect of the tabular features on model’s prediction.
Predicted probability of composite outcome: 0.948, RVSD: Present, RVD: Present
