
Figure 3. ZFTA-fusion proteins drive an aberrant transcriptome.
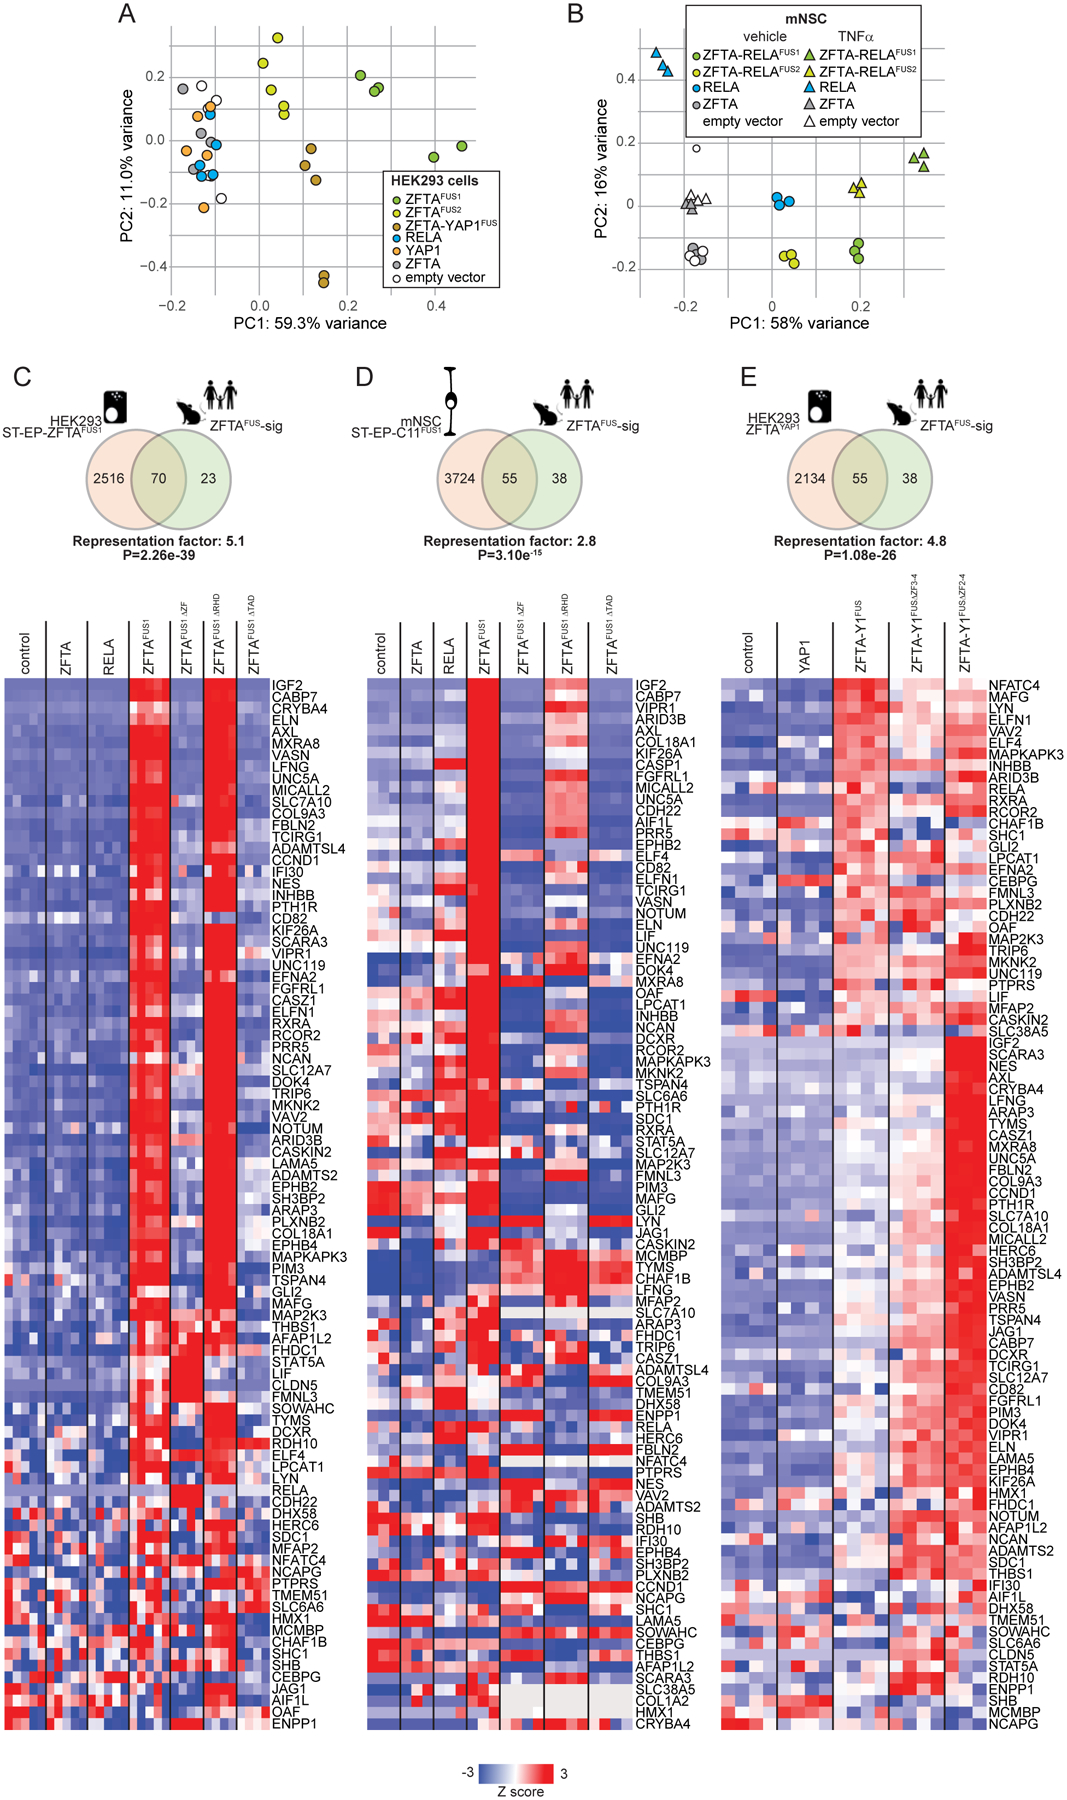
Principal components analysis of RNAseq profiles of HEK293 (A) and mNSCs (B) transduced with the indicated genes. mNSCs were also treated with TNFα (2 hours) or control (phosphate buffered saline). C-E, top in each, Venn diagram of overlap in genes upregulated (FDR<0.05) by the indicated ZFTA-fusion protein in the indicated cell type, with the ZFTAFUS-sig gene set (representation factor and p-value for overlap are shown). Below in each, heatmaps reporting expression of ZFTAFUS-sig genes in corresponding cells harboring the indicated gene.