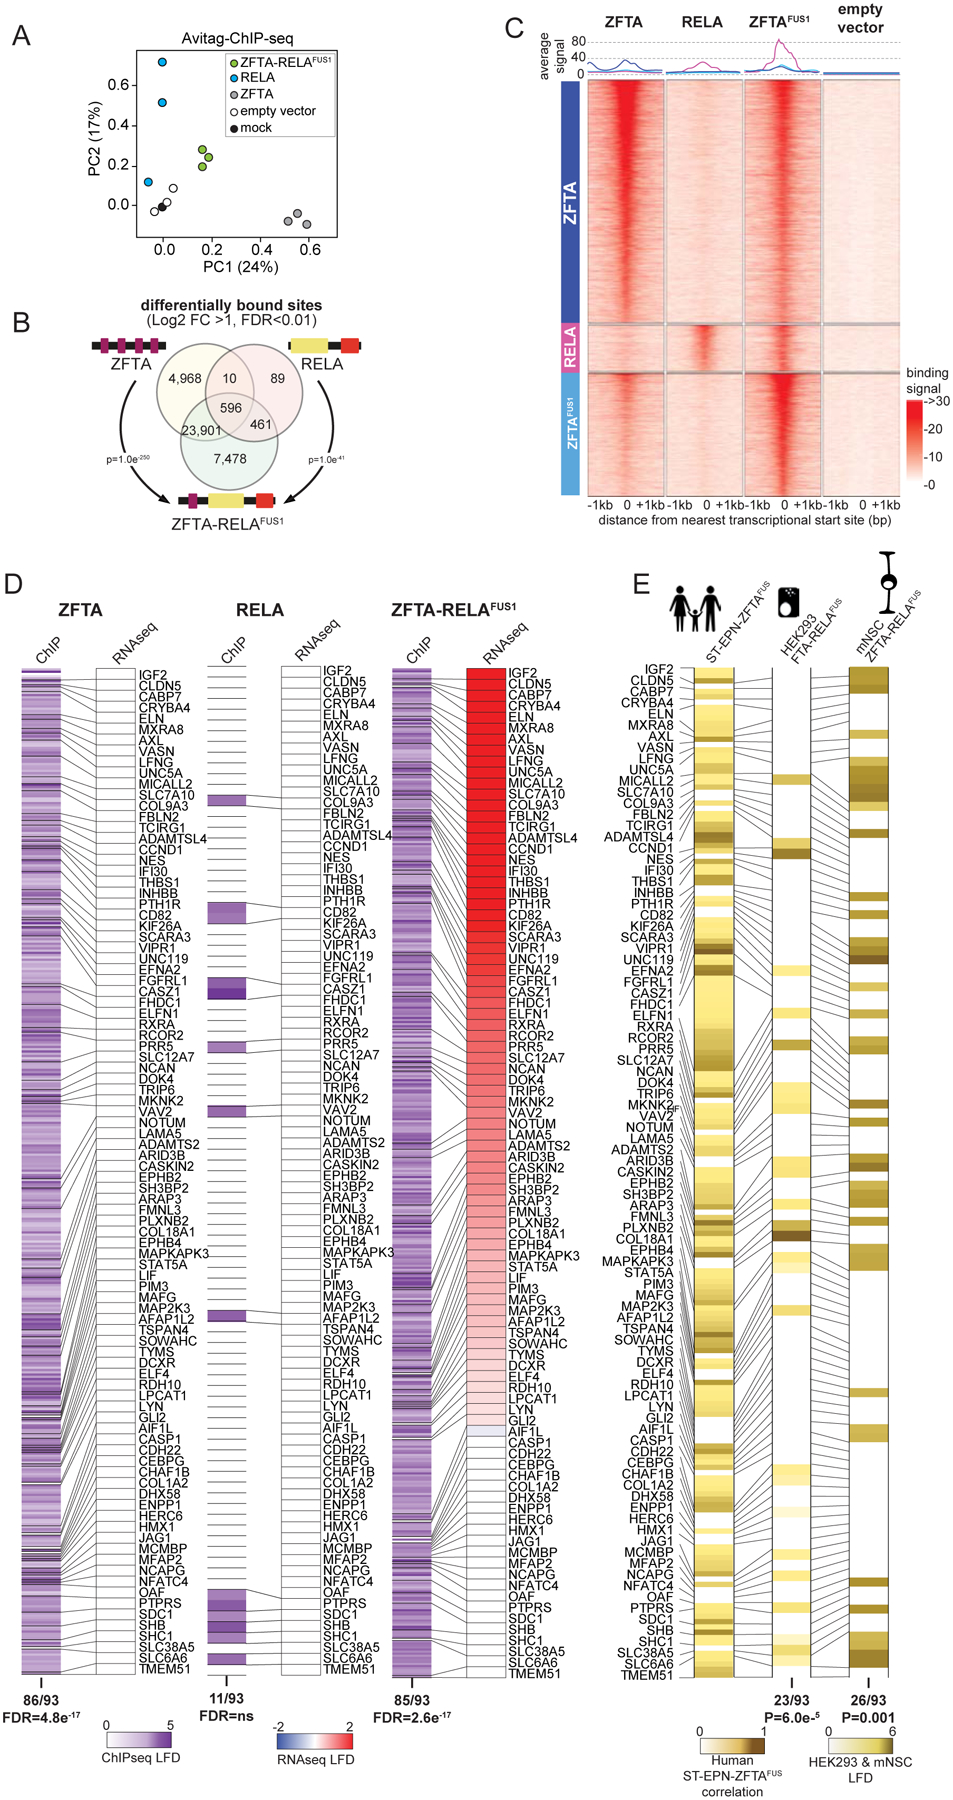
Figure 4. ZFTA-RELAFUS1 remodels the chromatin landscape.

A. Principal components analysis of ChIP-seq profiles of chromatin binding by the indicated proteins in HEK293 cells. B. Venn diagram of overlap in ChIP-seq detected DNA binding sites of the indicated proteins (DESeq2 detected consensus peaks in ≥2 ChIP-seq samples). P-values report representation factor for overlap of indicated binding sites. C. Signal profile heatmaps of representative ChIP-seq samples for ZFTA, RELA, ZFTA-RELAFUS1 and empty vector transduced HEK293 cells showing distance to nearest translational start site (+/− 1Mbp). Three groups of binding sites (left column), sorted by decreasing number of overlapping reads, are used: top, 5000 ZFTA differentially bound sites, middle, 958 RELA differentially bound sites not also bound by ZFTA, bottom, ZFTA-RELAFUS1 top 2500 sites differentially bound, not also bound by ZFTA or RELA; all vs. empty vector. Above, average signal for each binding site group. D. Heatmaps of ChIP seq DNA binding (left in each) and RNAseq expression (right in each) level of ZFTAFUS-sig genes in HEK293 cells transduced with the indicated fusion. E. Heat map of H3K27ac marks in ZFTAFUS-sig genes in ST-EP-ZFTAFUS human tumors (left), or ZFTA-RELAFUS1 transduced HEK293 cells (middle) or mNSC (right).
