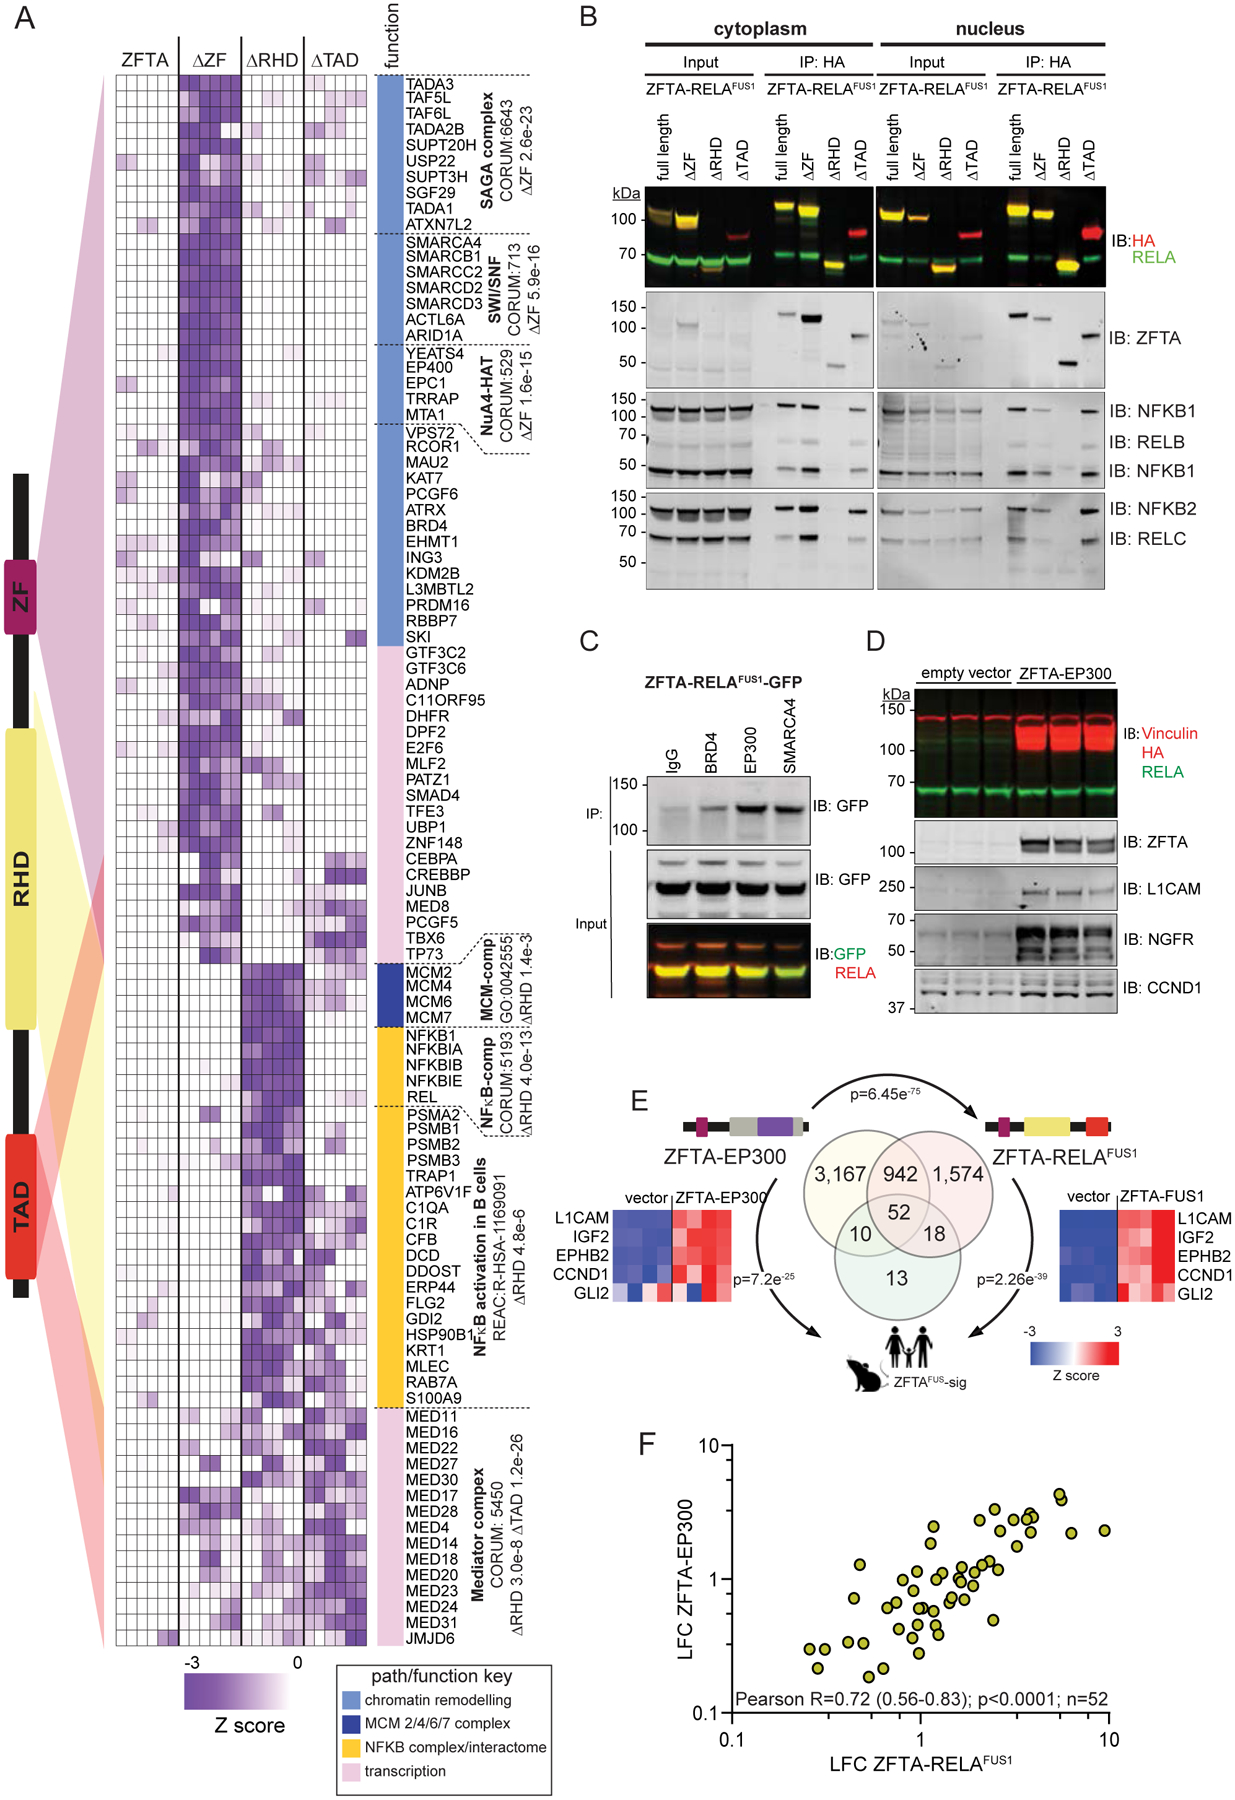
Figure 6. Protein complexes recruited by ZFTA-RELAFUS1.

A. Left, schematic of ZFTA-RELAFUS1. Colored triangles indicate proteins in heatmap (right) that are lost from the ZFTA-RELAFUS1 interactome when the associated protein domain is deleted. Pathways enriched with significant interacting proteins are shown right. Western blot of protein lysates of HEK293 expressing ZFTA-RELAFUS1 (B and C) or ZFTA-EP300 (D) tagged proteins that were immunoprecipitated (IP) and then probed (IB) with the indicated antibodies. E. Venn diagram of overlap in genes upregulated (FDR<0.05) by the indicated fusion protein in HEK293 cells with the ZFTAFUS-sig gene set (p-value for overlap). Heatmaps report representative ZFTAFUS-sig gene expression including GLI2. F. Correlation of 52 ZFTAFUS-sig genes upregulated by the ZFTA-EP300 and ZFTA-RELAFUS1 in HEK293 cells.
