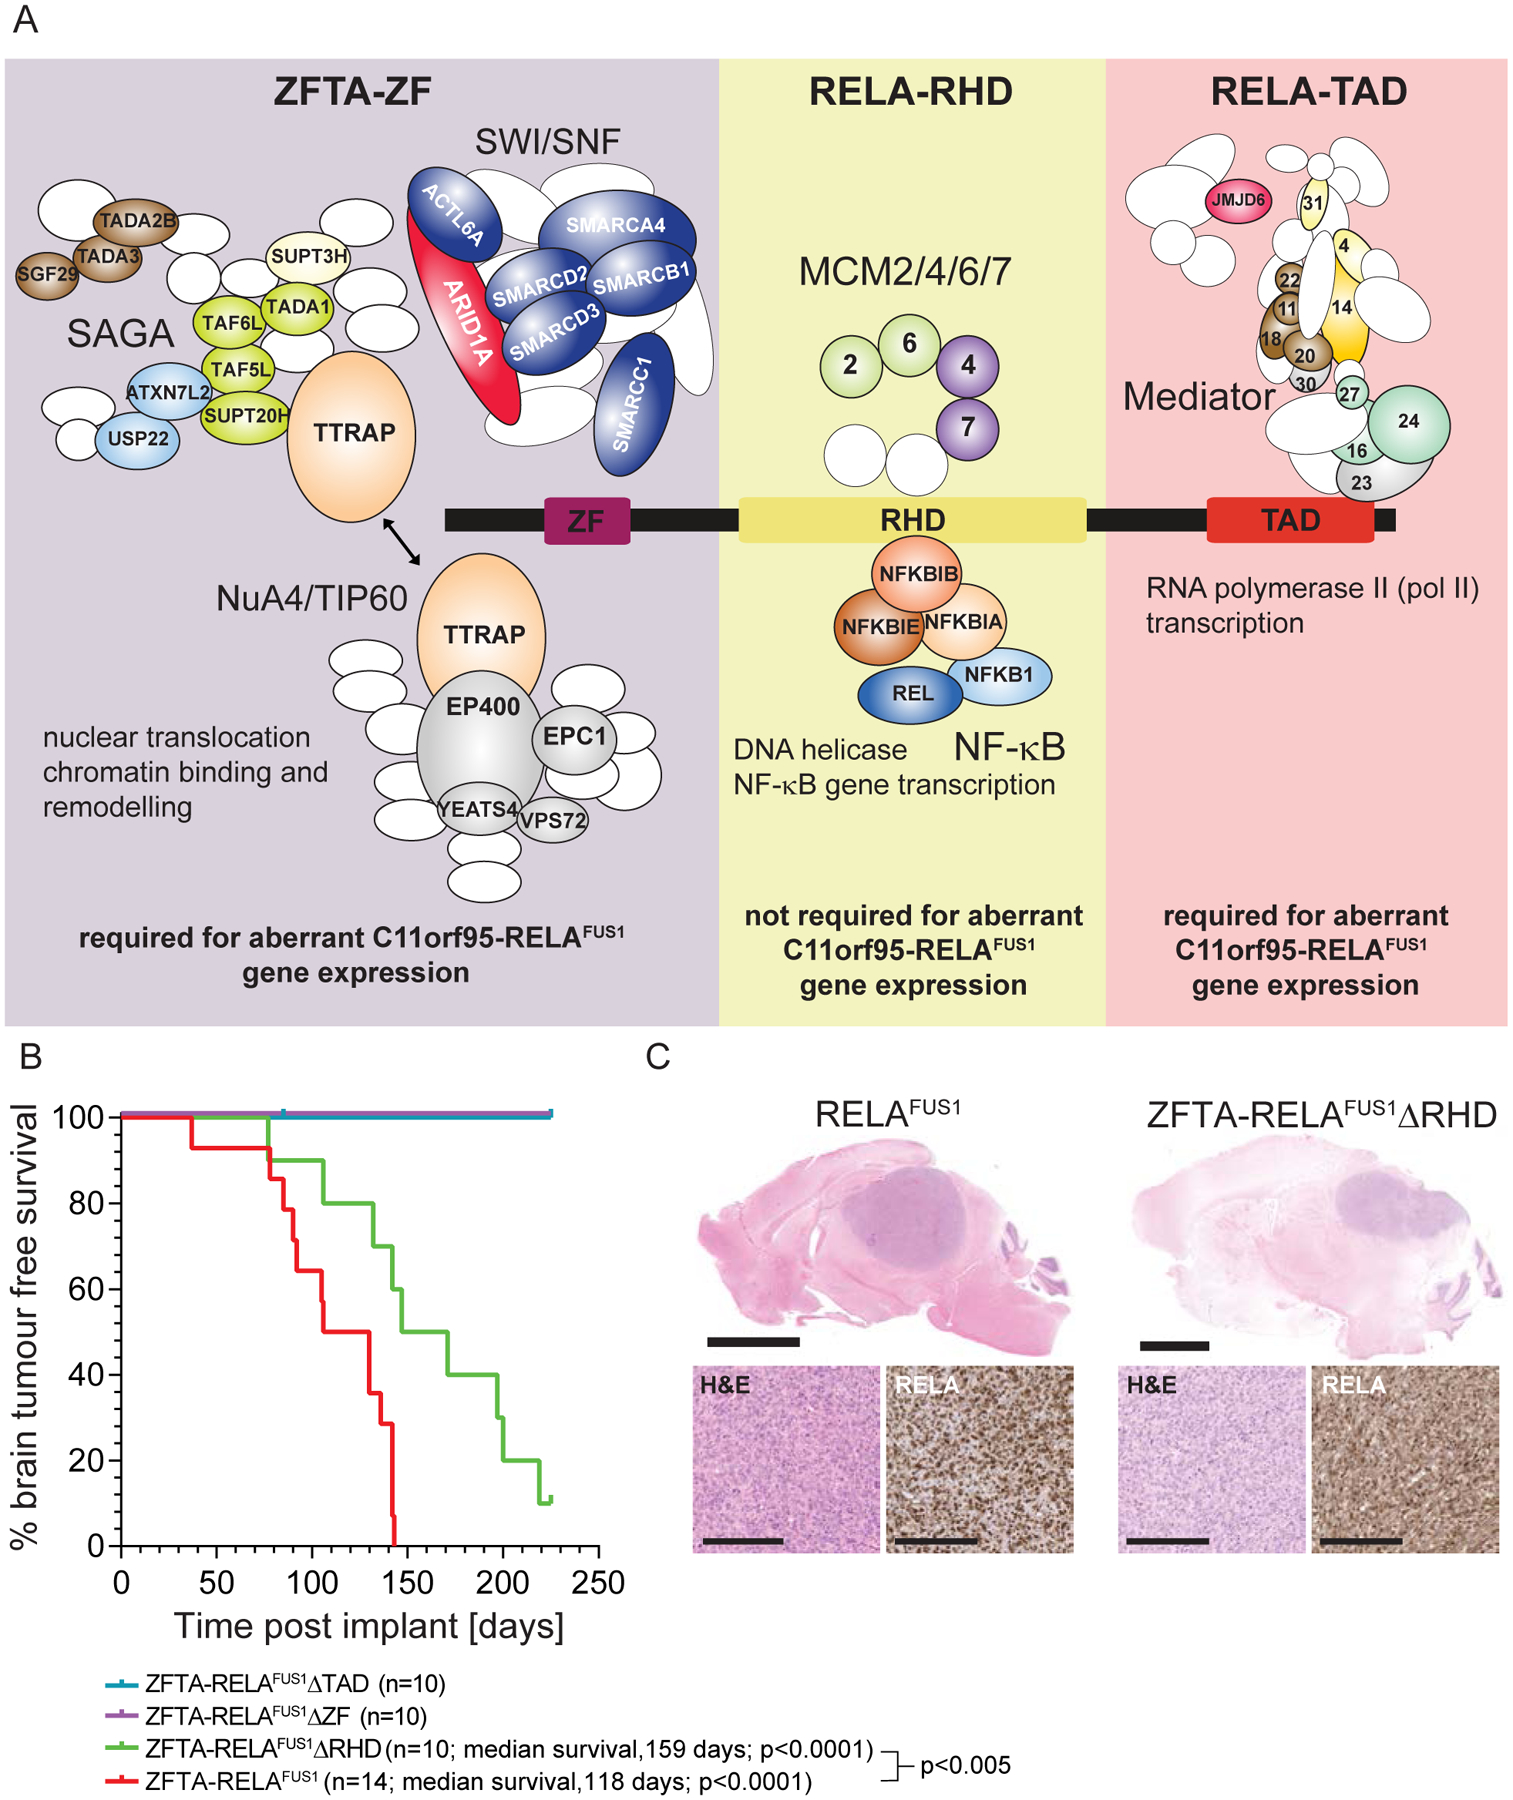
Figure 7. Molecular and cancer phenotype characteristics of ZFTA-RELAFUS1 protein domains.

A. Schematic depicting the protein complexes that bind each ZFTA-RELAFUS1 domain. Protein subunits identified in each domain interactome by qPLEX-RIME are colored and labelled in complexes. Complex components not identified are white ovals/circles. B. Kaplan-Meier brain tumor-free survival curves of mice allografted with mNSCs transduced with the indicate cDNAs. P values report the Log-Rank statistic. C. Top (low power, scale=3mm) and bottom left (high power, scale=10μm) in each figure, photomicrographs of hematoxylin and eosin stained tumors in the brains of mice allografted with mNSCs transduced with the indicated cDNA. Bottom right in each figure are p65-RELA immunostains of tumor sections.
