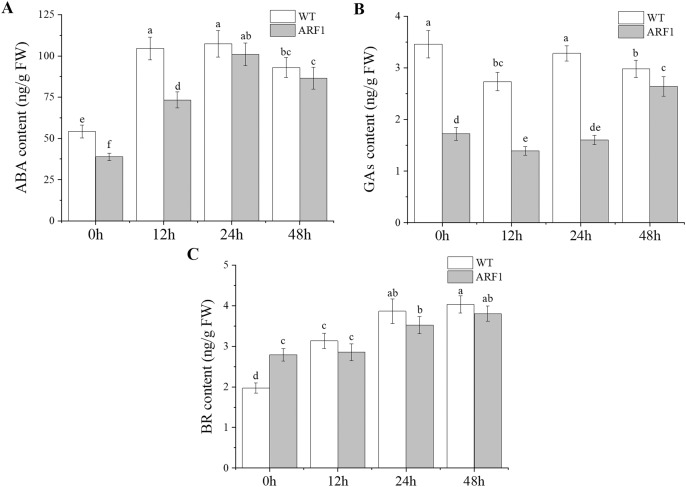
Figure 7. Contents of endogenous hormones in T3 CgARF1-overexpressing Arabidopsis plants under IAA treatment.
The abscissa denotes the time, where 0 h represents the stimulus onset. The significance of differences was estimated using ANOVA and Duncan’s tests. Different letters indicate significant differences between two samples within a single group (P < 0.05).

