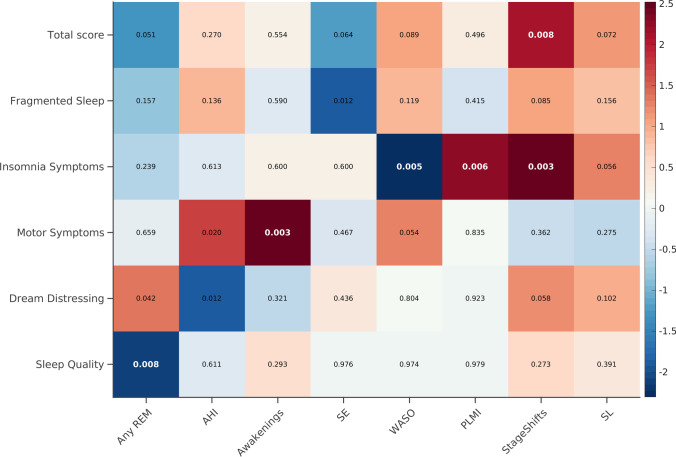
Fig. 1.
GLM analyses results. GLM direct (red to white) or inverse (blue to white) correlations are shown. The p-values for each correlation are reported. The colour bar represents the correlation coefficients. The p-values that survived the FDR correction are reported in bold white. All analyses were adjusted for age, MMSE and MDS-UPDRS-III. AHI = Apnoea-hypopnea index; GLM = Generalized linear model; MDS-UPDRS-III = Movement Disorders Society-sponsored revision of the Unified Parkinson’s Disease Rating Scale, motor section; MMSE = Mini Mental State Examination; PDSS-2 = Parkinson’s Disease Sleep Scale-2; PLMI = Periodic leg movements index; REM = Rapid eye movement; SE = Sleep efficiency; SL = Sleep latency; WASO = Wake after sleep onset

