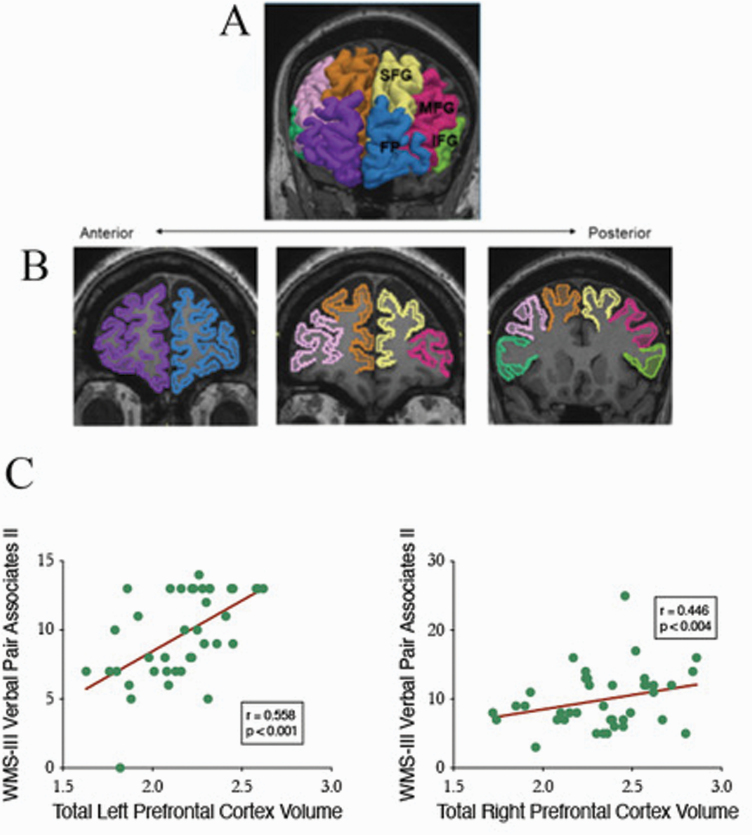
Fig. 1.
MR images of four prefrontal cortex (PFC) sub-regions. In each case, radiologic convention is followed with left hemisphere of participant shown on viewer’s right. (A) 3-Dimensional reconstruction of four PFC sub-regions. ROIs are superimposed on coronal SPGR image: frontal pole (FP left: blue, right: purple), superior frontal gyrus (SFG left: yellow, right: brown), middle frontal gyrus (MFG left: red, right: pink), and inferior frontal gyrus (IFG left: light green, right: dark green). (B) ROIs in coronal slices of SPGR images. Color coding of (B) is the same of that of (A). Boundary definitions are described in Method. (C) Scatter plots of WMS-III Verbal Paired Associates II and total gray matter volumes for left PFC and right PFC for combined patient and control sample.

