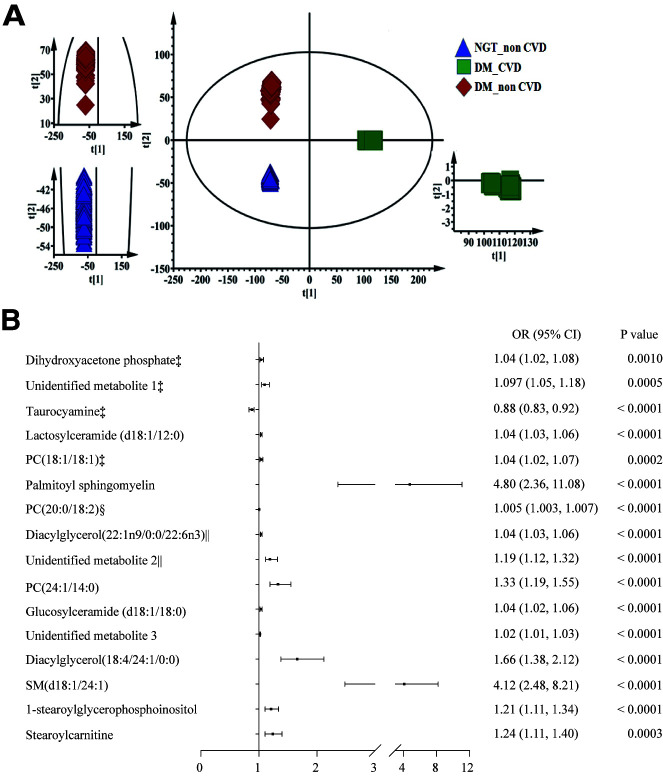
Figure 1.
Plasma metabolic profiles among patients with DM with and without CVD and the control group using PCA and each metabolite related with the risk of CVD in patients with diabetes. A: The score plots show a statistically significant difference in data between the DM and NGT groups, indicating significant biochemical changes caused by hyperglycemia. Furthermore, there was a clear separation between DM_CVD and DM_non-CVD, indicating that metabolites can differentiate diabetes with and without CVD. B: Association between each metabolite and CVD in diabetes after adjustment for age, sex, smoking, BMI, SBP, FPG, and TC. PC, glycerophosphocholine. ‡Per 0.01-unit increase; §per 0.1-unit increase; ǁper 10-unit increase.

