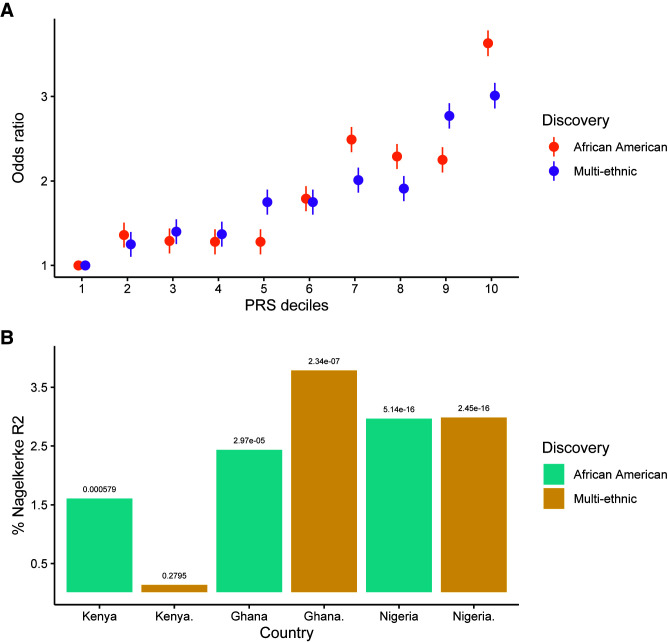
Figure 1.
A: Shape plot for the difference in odds ratio for T2D (adjusted for age, sex, BMI, and five principal components) in reference to the first decile for the African American PRS in the AADM study. B: Bar plots showing the transferability of the PRS in African countries represented in the AADM study.

