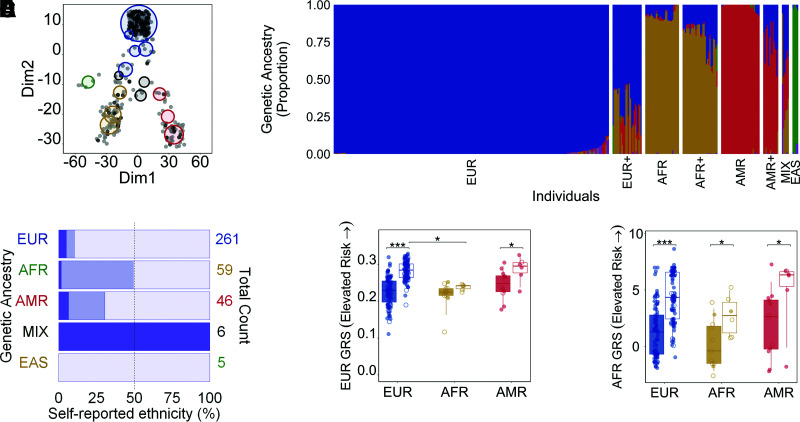
Figure 1.
Analysis of T1D GRSs by ancestry. Colors denote individuals of EUR (blue), AFR (brown), AMR (red), EAS (green), and SAS (purple) genetic ancestry. A: Individuals (n = 377) are plotted as light (no T1D) and dark (T1D) gray circles according to their proportions of EUR, AFR, AMR, EAS, and SAS ancestry. Each non-gray-colored circle represents the center of a cluster of individuals; the size of the circle is proportional to the number of people in a cluster. Each cluster contains individuals of a single ancestry with a proportion of ≥0.88 (4 circles; blue circle at the top, red and yellow circles at the bottom, and the green circle), multiple ancestries in equal proportions (3 circles; termed MIX, black), or a single ancestry with contributions from others (8 remaining circles). B: Ancestry composition of all 377 individuals. A plus sign (+) denotes individuals within a group with increasing proportions from other ancestries. C: The percentage of agreement between the calculated genetic ancestry (B) and self-reported ethnicity taken from hospital medical charts (Caucasian, African American, Hispanic/Latino, Asian, American Indian/Alaska Native, and >1 group). Racial and ethnic categories are based on the United Network for Organ Sharing definitions. Transparent purple represents concordance (e.g., an individual determined to be of AMR ancestry and self-reported as Hispanic/Latino), light purple is partial agreement (e.g., AMR+ ancestry and Hispanic/Latino), and dark purple denotes discordance (e.g., AMR or AMR+ and Caucasian). D and E: GRS values were compared within each ancestry for those with (box with no color fill) and without (solid color) T1D using EUR (D) and AFR (E) models. Data points with no fill color represent individuals with admixture ranging from a proportion of >0.01 to 0.11. *P ≤ 0.05; ***P ≤ 0.0001.

