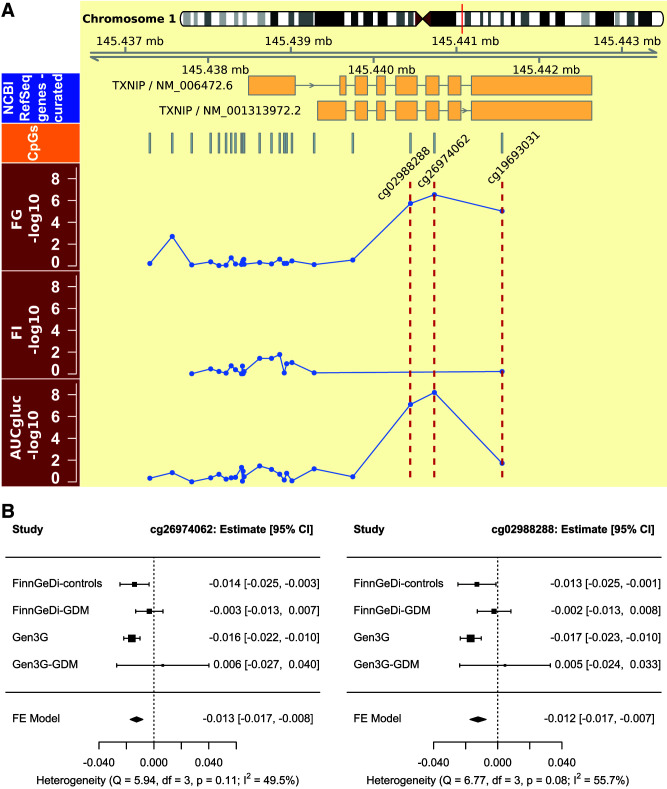
Figure 1.
Overview of findings at TXNIP. A: Chromosomal and gene map for the TXNIP locus (top), followed with the locations of the CpGs incorporated in the meta-analysis. Highlighted with red dotted lines are CpGs cg02988288, cg26974062, and cg19693031 in the panels with −log10 nominal P values for the meta-analyses on FG, FI, and AUCgluc for the measured CpGs in TXNIP. B: Forest plot for the AUC of an OGTT meta-analysis stratified by GDM status for the two CpGs that were genome-wide significant. Gen3G-GDM, GDM case subjects from the Gen3G cohort; NCBI, National Center for Biotechnology Information; FE, fixed-effect.

