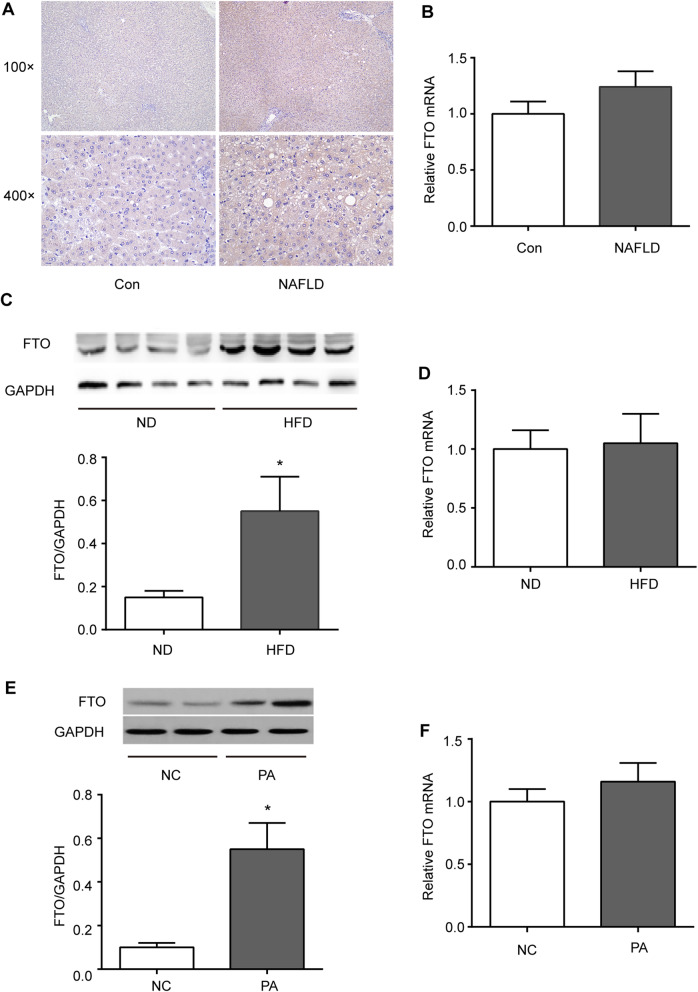
Fig. 1.
Upregulation of FTO in nonalcoholic fatty liver disease (NAFLD). A, B Immunohistochemical and quantitative real-time polymerase chain reaction (qRT-PCR) analyses of FTO protein and mRNA expression in the livers from patients with and without NAFLD (n = 4 per group). C, D Western blotting and qRT-PCR analyses of the FTO protein and mRNA expression in the livers of mice fed a high-fat diet (HFD) or normal diet (ND) for 16 weeks (n = 6 mice per group). Band intensities were quantified via densitometry. Relative expression was normalized to GAPDH and is expressed as the fold-change relative to the controls. E, F Western blotting and qRT-PCR analyses of the FTO protein and mRNA expression in HepG2 cells treated with palmitic acid (PA) (0.5 mM) for 24 h. Band intensities were quantified via densitometry. *P < 0.05 vs. control group

