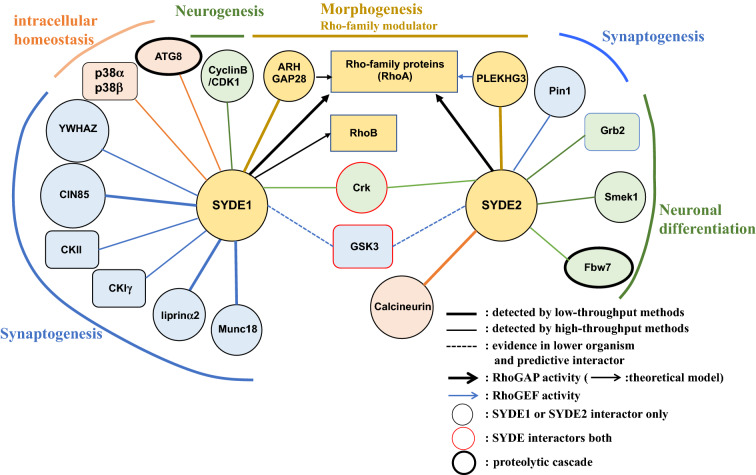
Figure 6.
SYDE protein interaction network. SYDE binding partners identified by low-throughput data (bold line), high-throughput protein–protein interaction data or linear motifs prediction (thin line), and the interactions mediated by conserved sequences as linear motif that are predicted to be associated with binding partner proven in lower organism (dotted line). Interactors are represented by different shapes based on their molecular function: protein kinases (rectangles); degradation machineries (bold-lined ovals); adaptor proteins or phosphatases (circles). Interactor is colored and categorized by neuronal regulatory function as follows: Rho-family modulators (yellow); synaptogenesis (light blue); intracellular homeostasis (light pink); neuronal differentiation (green). SYDE interactor both is marked by red edges and either SYDE1 or SYDE2 only binding partner is represented by black edges. CKIγ casein kinase Iγ, CKII casein kinase 2.

