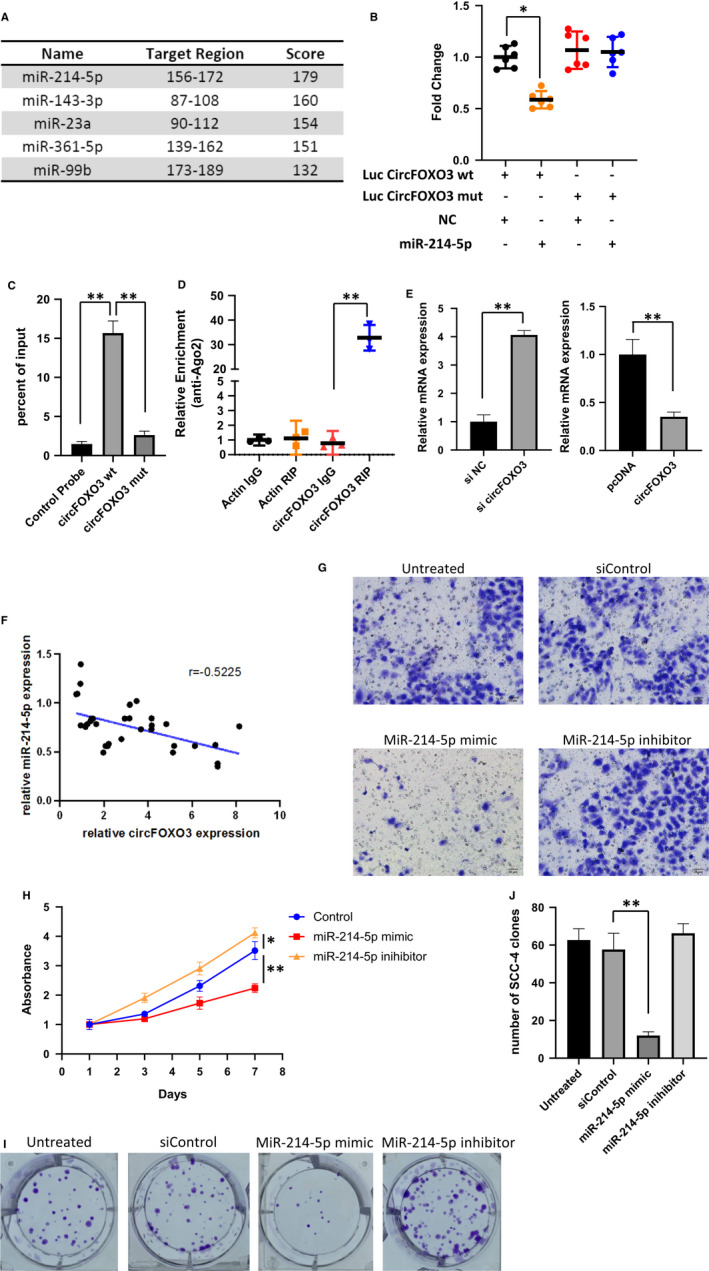
FIGURE 3.

circFOXO3 acts as a miRNA sponge for miR‐214. A, Bioinformatics analysis of circFOXO3 binding miRNAs. B, Luciferase activity was measured in circFOXO3 WT, Mut plasmids with miR‐214 co‐transfected 293T cells. Data are presented as means ± SD (n = 3). *P < .05. C, RNA pull‐down was conducted to measure the miR‐214 expression on circFOXO3 WT and Mut enrichment. Data are presented as means ± SD (n = 3). **P < .01. D, AGO2 IP assay was performed to detect CircFOXO3 levels in 293Tcells stably expressing AGO2. Data are presented as means ± SD (n = 3). **P < .01. E, Relative expression of miR‐214 in si‐NC (Negative Control)/si‐circFOXO3 and NC (Negative Control)/pcDNA‐circFOXO3 infected SCC‐4. Data are presented as means ± SD (n = 3). **P < .01. F, The correlation of circFOXO3 and miR‐214 expression level in OSCC tumor tissues analyzed by Pearson (r = .5225, P < .05). G, The effects of miR‐214 mimic/inhibitor on both SCC‐4 cell invasion. A total of 1 × 10⁵ transfected cells were seeded onto a permeable membrane in a Boyden chamber to allow the cells to invade the opposite layer of the membrane. H, SCC‐4 cells were transfected as indicated and cultured for different times. Cell viability was measured by CCK‐8 assay. Data represent the means ± SD (n = 3). *P < .05, **P < .01. I, Proliferation of SCC‐4 cells transfected with siControl, miR‐214 mimic or inhibitor, as detected by colony formation assay. J, Quantitative analysis of clone numbers with indicated treatment. Data are presented as means ± SD (n = 3). **P < .01
