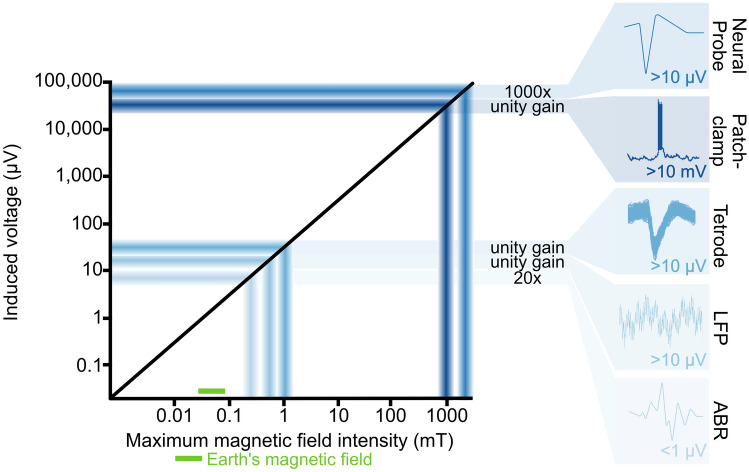
Fig. 2.
Schematic of indicative maximum feasible induction values for given electrophysiology techniques. Insets show typical signals reaching the acquisition system for the different methods. For all examples the length of the cable is 0.5 m, the diameter of the loop is 1 cm, the rotation () is 90 degrees, rotation time ( is 0.25 s and the magnetic field () 50 µT. Different studies and analysis techniques calculate different acceptable threshold noise levels (Quiroga et al. 2004; Doucette et al. 2011; Simmons and de Ruyter van Steveninck 2005), but all primarily depend on variants of the signal-to-noise ratio . For the calculations of this schematic, we assumed an induced voltage to be no bigger than 1 × , with an acceptable threshold signal of 3 × (Doucette et al. 2011). The neural probe is assumed to have 1000 × pre-amplification at the headstage (Jun et al. 2017), while patch-clamp, tetrode single unit and local field potential (LFP) recordings are assumed to have unity gain amplification (Maurer et al. 2006; Kropff et al. 2021; Markham and Zakon 2014), and ABR recordings are assumed to have 20 × amplification (Hayes et al. 2019). The maximum usable magnetic field intensity for a given technique and rig setup can be extrapolated based on the maximum induction voltage

