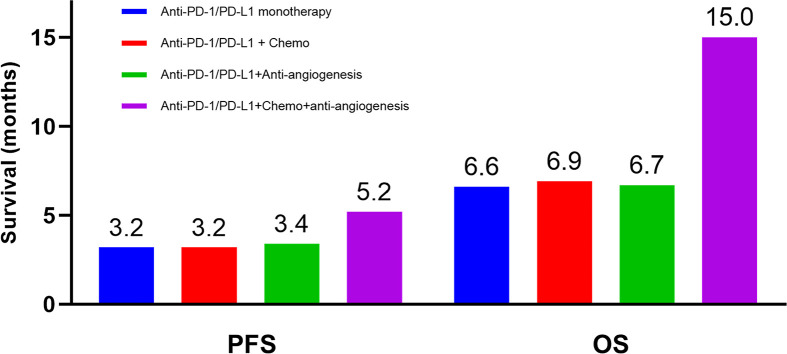
Figure 2.
Median survival of patients with different therapeutic regimen. Blue: anti-PD-1/PD-L1 monotherapy, Red: anti-PD-1/PD-L1 plus chemotherapy, Green: anti-PD-1/PD-L1 plus anti-angiogenic agents, Purple: anti-PD-1/PD-L1 plus chemotherapy plus anti-angiogenic therapy. PFS, progression-free survival; OS, overall survival.

