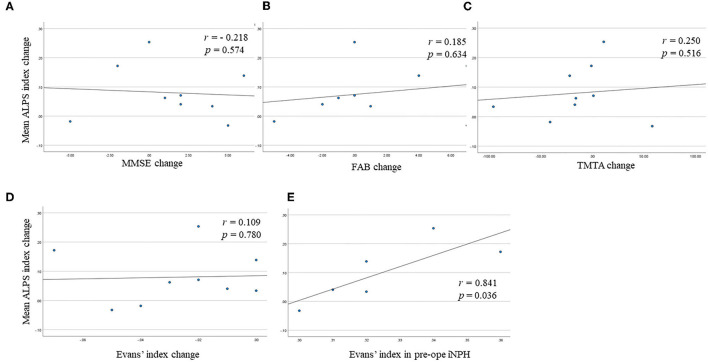
Figure 3.
Scatter plots show (A) the correlation between the mean analysis along the perivascular space (ALPS) index change and Mini-Mental Statement Examination (MMSE) score change, (B) the correlation between the mean ALPS index change and Frontal Assessment Battery (FAB) score change, (C) the correlation between the mean ALPS index change and Trail Making Test A (TMTA) score change, (D) the correlation between the mean ALPS index change and Evans' index change, (E) the correlation between the mean ALPS index change and Evans' index in pre-operative idiopathic normal pressure hydrocephalus (iNPH) group in responder subjects.

