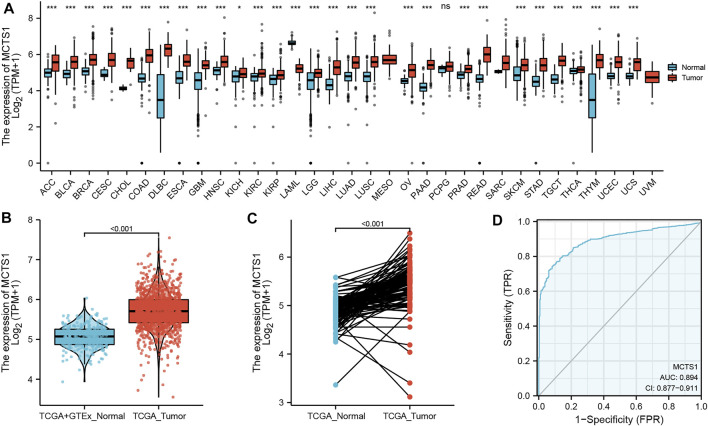
FIGURE 1.
Expression levels of MCTS1 in different types of tumors and breast cancer. Expression of MCTS1 (A) in different types of tumors compared with normal tissues in TCGA and GTEx databases, (B) in breast cancer and non-matched normal tissues in the TCGA and GTEx databases, and (C) in breast cancer and matched normal tissues in TCGA database. (D) ROC curves for classifying breast cancer versus normal breast tissues in the TCGA database. TCGA, The Cancer Genome Atlas; GTEx, Genotype Tissue Expression Project; ROC, receiver operating characteristic. ∗ p < 0.05, ∗∗ p < 0.01, and ∗∗∗ p < 0.001.

