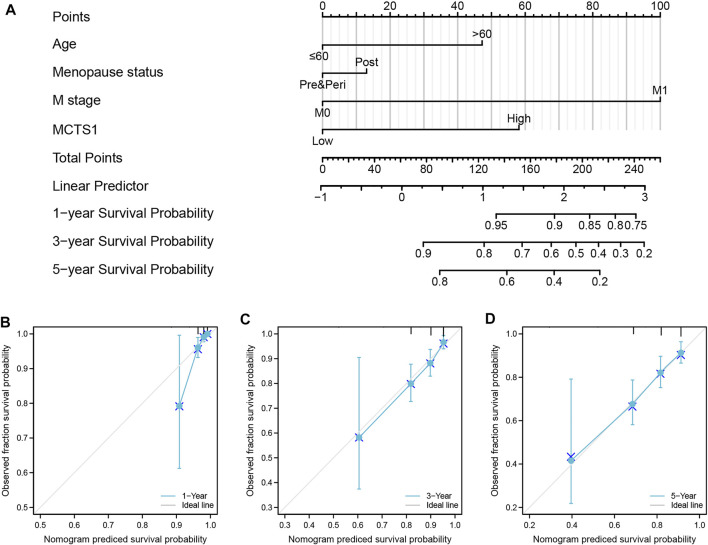
FIGURE 10.
A nomogram and calibration curves for prediction of one-, three-, and five-year overall survival rates of patients with breast cancer. (A) A nomogram for prediction of one-, three-, and five -overall survival rates of patients with breast cancer. (B–D) Calibration curves of the nomogram prediction of one-, three-, and five-year overall survival rates of patients with breast cancer.

