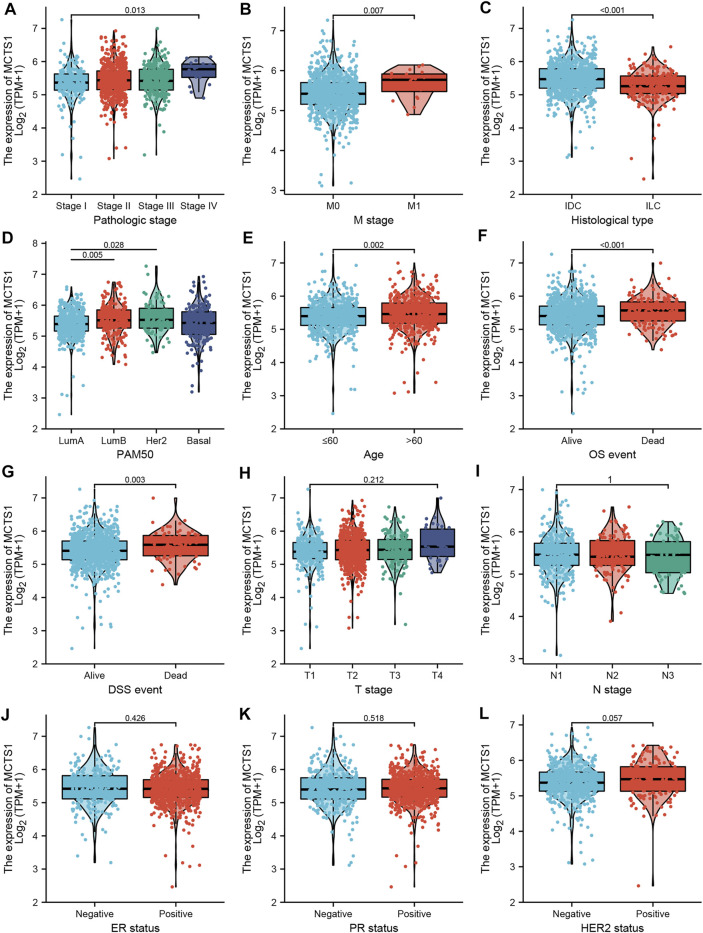
FIGURE 3.
Associations between MCTS1 expression and clinicopathological characteristics. Data are shown for (A) pathological stage; (B)M stage; (C) histological type; (D) PAM50; (E) age; (F) OS event; (G) DSS event; (H) T stage; (I) N stage; (J) ER status; (K) PR status; and (L) HER2 status. IDC, infiltrating ductal carcinoma; ILC, infiltrating lobular carcinoma; LumA, Luminal A; LumB, Luminal B; OS, overall survival; DSS, disease-specific survival; ER, estrogen receptor; PR, progesterone receptor; HER2, human epidermal growth factor receptor 2.

