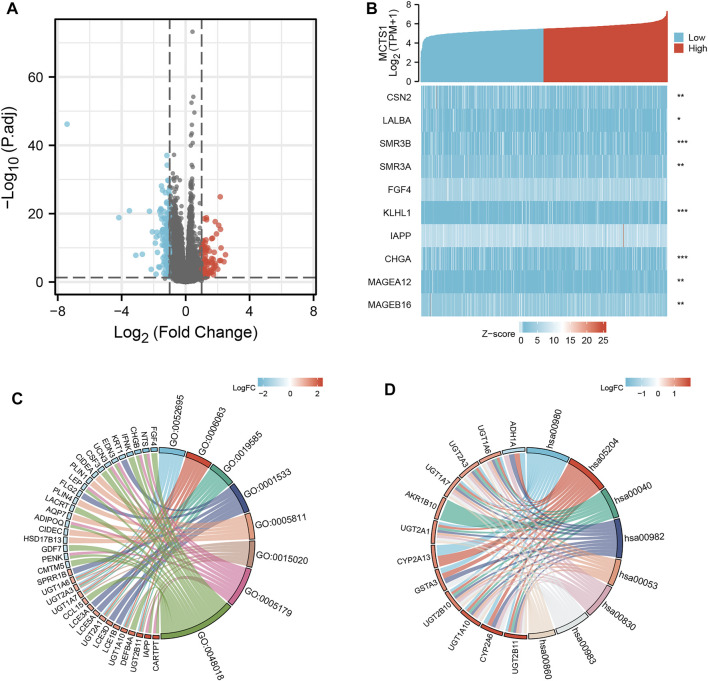
FIGURE 4.
MCTS1-related differentially expressed genes (DEGs) and functional enrichment analysis of MCTS1 in breast cancer using GO and KEGG. (A) Volcano plot of DEGs. Blue and red dots indicate the significantly down-regulated and up-regulated DEGs, respectively. (B) Heatmap of correlation between MCTS1 expression and the top 10 DEGs. (C) GO analysis of DEGs. (D) KEGG analysis of DEGs. GO, Gene Ontology; KEGG, Kyoto Encyclopedia of Genes and Genomes; DEGs, differentially expressed genes. ∗ p < 0.05, ∗∗ p < 0.01, and ∗∗∗ p < 0.001.

