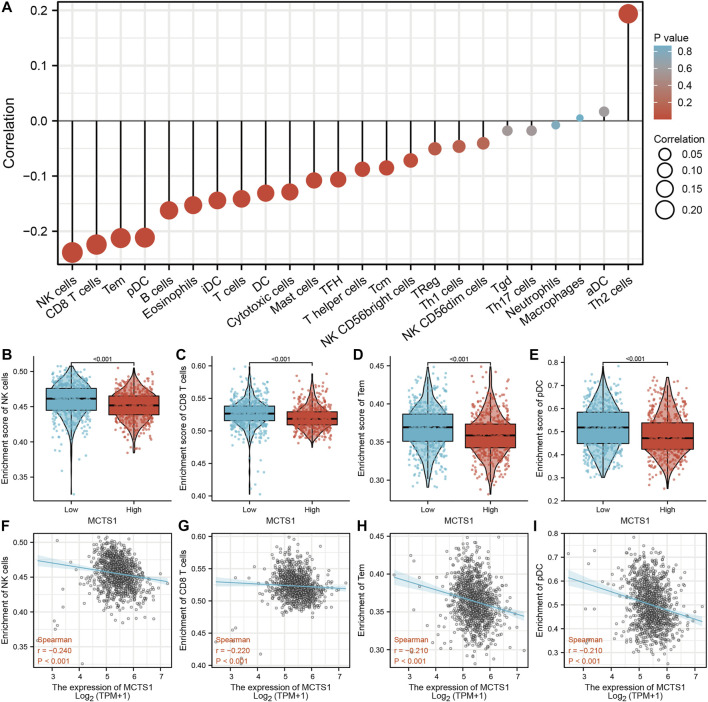
FIGURE 7.
Correlation of MCTS1 expression with immune infiltration level in breast cancer. (A) Correlation between MCTS1 expression and relative abundance of 24 types of immune cell. The size of dot corresponds to the absolute Spearman’s correlation coefficient values. (B–E) Comparison of immune infiltration levels of immune cells (including NK cells, CD8+ T cells, TEM cells, and pDCs) between the high- and low-MCTS1 expression groups. (F–I) Correlations between the relative enrichment scores of immune cells (including NK cells, CD8+ T cells, TEM cells, and pDCs) and the expression of MCTS1. NK cells, natural killer cells; TEM cells, effector T cells; pDCs, plasmacytoid dendritic cells.

