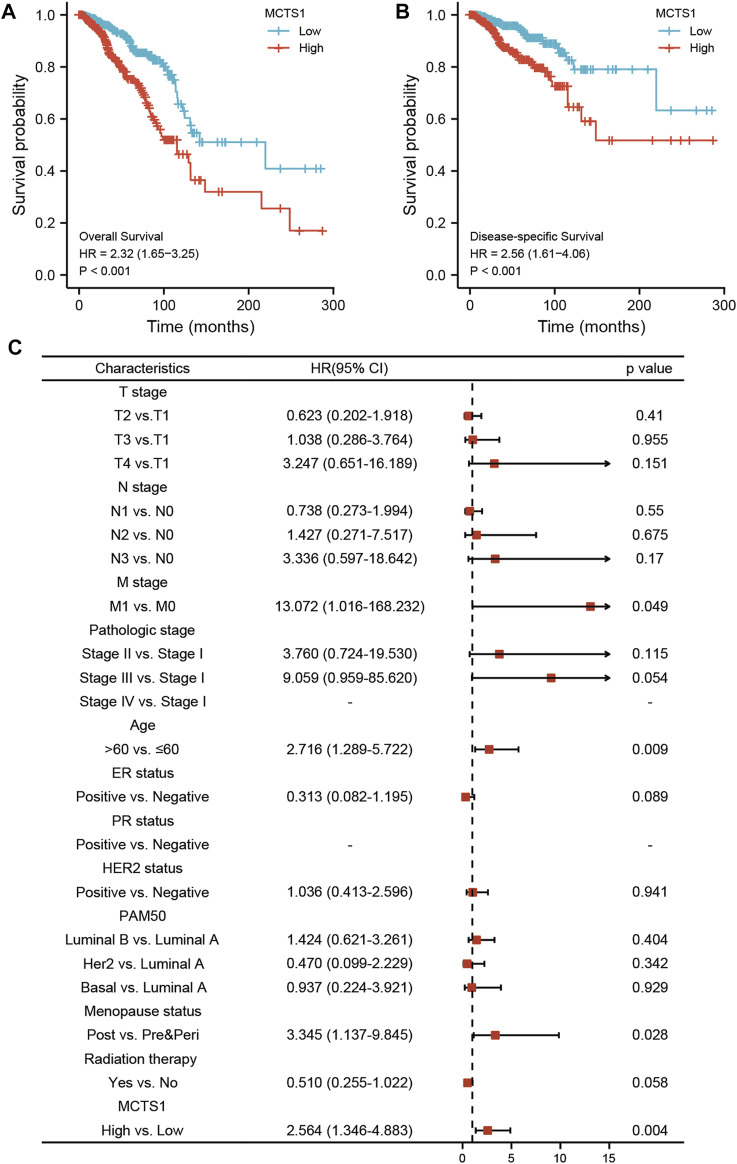
FIGURE 8.
Prognostic values of MCTS1 expression in patients with breast cancer evaluated by the Kaplan-Meier method. Overall survival (A) and disease-specific survival (B) for breast cancer patients with high versus low MCTS1. (C) Forest map based on multivariate Cox analysis for overall survival. HR, hazard ratio; CI, confidence interval. ER, estrogen receptor; PR, progesterone receptor; HER2, human epidermal growth factor receptor 2.

