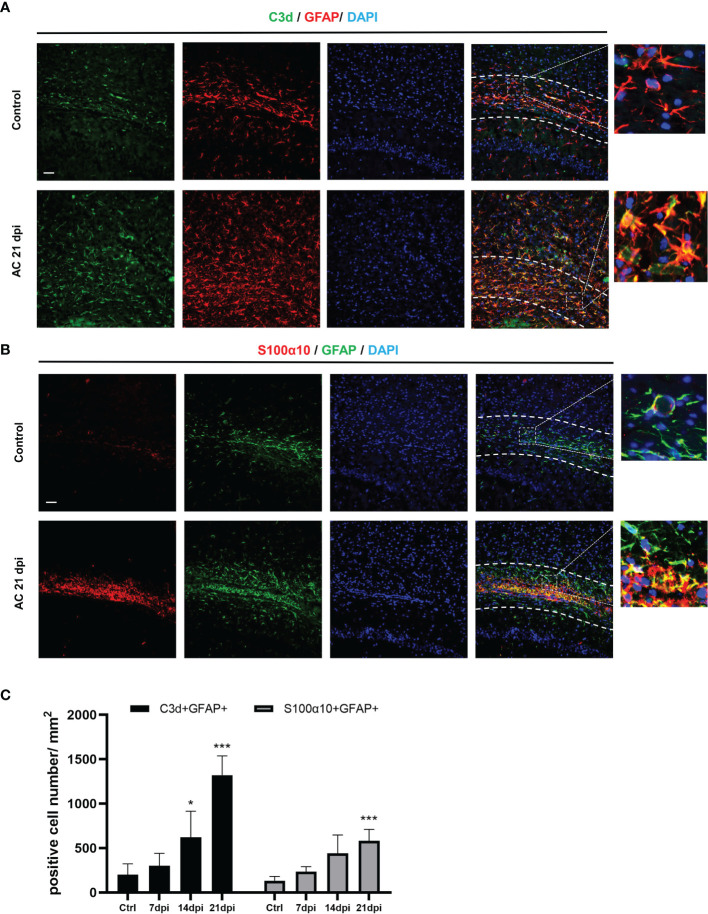
Figure 2.
A. cantonensis infection caused activation of A1 and A2 astrocytes in the corpus callosum. (A, B) Representative sections showing that distribution of GFAP+, C3d+ and GFAP+, S100α10+ cells in the corpus callosum. (C) Quantification of GFAP+, C3d+ and GFAP+, S100α10+ cells at 7, 14, and 21 dpi. Scale bar = 50 μm. n = 4-5 animals/group, *P < 0.05, ***P < 0.001. Data were analyzed by one-way ANOVA and followed by Tukey’s post hoc analysis. Data in each statistical graph are presented as the mean ± SEM.

