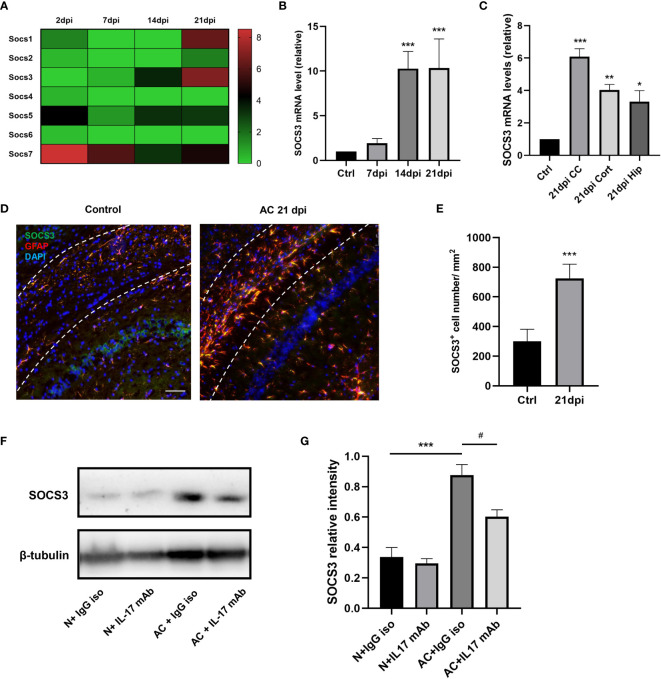
Figure 6.
IL-17A regulated SOCS3 expression in astrocytes during A. cantonensis infection. (A, B) Results of gene enrichment analysis was processed through comparing SOCS family mRNA levels and qPCR results of SOCS3 in infected mice brains at 2, 7, 14, and 21 dpi. (C) qPCR assay was performed to assess SOCS3 gene levels of different brain regions at 21 dpi (CC = corpus callosum, Cort = cortex, Hip = hippocampus). (D) Representative images of SOCS3 and GFAP staining of control and 21 dpi groups. Scale bar = 75 μm. (E) Quantification of GFAP+, SOCS3+ cells at 7, 14, and 21 dpi. (F) Western Blotting results showed SOCS3 protein levels of individual treated groups. (G) Relative densitometric analysis of Western Blotting is represented, as normalized to β-actin. n = 5 animals/group, *P < 0.05, **P < 0.01, ***P < 0.001, #P < 0.05. Data were analyzed by one-way ANOVA and followed by Tukey’s post hoc analysis. Data in each statistical graph are presented as the mean ± SEM.

